<?xml version="1.0" encoding="utf-8"?><feed xmlns="http://www.w3.org/2005/Atom" ><generator uri="https://jekyllrb.com/" version="3.9.5">Jekyll</generator><link href="https://www.shroudedincloaksofboringness.com/feed.xml" rel="self" type="application/atom+xml" /><link href="https://www.shroudedincloaksofboringness.com/" rel="alternate" type="text/html" /><updated>2024-07-07T19:16:56+00:00</updated><id>https://www.shroudedincloaksofboringness.com/feed.xml</id><title type="html">Shrouded in Cloaks of Boringness</title><subtitle>Modernity: &quot;Nothing to see here...&quot; Us: &quot;Nice try!&quot;</subtitle><entry><title type="html">Making Up Numbers</title><link href="https://www.shroudedincloaksofboringness.com/2023/09/20/makingupnumbers.html" rel="alternate" type="text/html" title="Making Up Numbers" /><published>2023-09-20T04:16:35+00:00</published><updated>2023-09-20T04:16:35+00:00</updated><id>https://www.shroudedincloaksofboringness.com/2023/09/20/makingupnumbers</id><content type="html" xml:base="https://www.shroudedincloaksofboringness.com/2023/09/20/makingupnumbers.html"><![CDATA[<p>Last year, some smart people asked me to write a review essay about data in the history of the social sciences. I tried. I did. But it turned out I didn’t have it in me. Such an undertaking requires the writer to float high above the terrain, describing its contours. Yet what interests me most is thinking about how to crouch close to the ground. So, what follows is an essay about a stance for thinking about data and the way we know what know about modern societies.</p>

<p>I begin with a supposition: that the majority of social numbers in modern societies result from the agency of states, the responses of “the people,” (in its various manifestations) and descends more or less directly from political action or the exercise of power. State offices and company skyscrapers are frequently marginal when we think of sites of social science, as are streets claimed by protestors. Yet we learn a great deal about where social numbers come from when we situate ourselves in those types of places and see what we can see.</p>

<p>In that spirit, I begin with a story about social numbers far from any seminar room, but exemplary of how social data systems work. In September 1956, the St. Regis Paper Company had recently completed a slew of acquisitions of other companies and would in the coming year make three more significant additions.  The United States’ Federal Trade Commission had been charged by Congress with keeping an eye on corporate expansion. St. Regis Paper’s action caught the attention of someone in the FTC, who opened an initial inquiry into possible anti-trust violations. FTC staff called on St. Regis Paper to cooperate, asking the company to hand over data pertaining to its business and especially its purchases of other corporations. The company delayed.</p>

<!---
St. Regis Paper Co. v. United States, 368 U.S. 208, decided 11 December 1961 at 213. A March annual report mentioned four new subsidiaries recently purchased. See “St. Regis Paper Co.” New York Times 2 March 1956. In December 1956, the company announced the purchase of J. Neils Number Company of Portland. See “St. Regis Paper Expands,” New York Times 28 December 1956.
--->

<p>By 1959, the FTC’s sniffing around had graduated to the status of a formal investigation, which meant that the FTC now demanded the previously requested data and further ordered the delivery of more data on even more acquisitions made by the still-expanding St. Regis Paper. But, again, the company delayed.  Lawsuits followed, culminating in a 1961 decision of the U.S. Supreme Court.</p>

<!---
St. Regis Paper Co. v. United States, 368 U.S. 208, decided 11 December 1961 at 214. The buying spree continued. St. Regis spent nearly $11 billion on American Sisalkraft Corpoartion in 1960. See “St. Regis Paper,” New York Times 24 August 1960 page 43
--->

<p>Among the data that St. Regis Paper refused to disclose were copies of reports that the company had earlier made to the U.S. Census Bureau. The reports themselves were protected by the confidentiality assurances in Title 13, the census law. But what was the status of the company’s own copy of that report, which it had retained at the behest of the bureau? (Each form bore the label: “Keep this copy for your files.”) The Supreme Court decided in favor of the trust-busting regulators and insisted the company should turn over its copies.</p>

<p>The Census Bureau and then Congress responded in alarm. By October 1962 a new law assured the confidentiality of such file copies, seemingly placing the needs of the statistical service over other enforcement priorities. Or did it? When advocating for legislative action, the Secretary of Commerce (who oversaw the Census Bureau) made a fascinating case that these statistical data were not fit for use in regulatory actions. Numbers generated for aggregate tables not only shouldn’t be used to judge individuals–they couldn’t be.</p>

<p>It’s worth considering this moment of controversy for the ways it shakes loose unstable assumptions about how it is that numbers and data systems really work in modern societies.</p>

<p>A substantial part of the problem was timing: the bureau wanted to generate annual statistics and to have time to tabulate all its inputs, it needed company figures before those companies were able to reckon out their own precise figures. Another problem had to do with definitions: the Census Bureau had its own uniform accounting systems, but they were often not the same as those employed by companies (requiring anyone who filled out the forms for the bureau to make some quick and dirty translations) or by other federal enforcement agencies. Finally, there was the problem of authority: companies relied on lawyers and accountants to prepare official financial statements, which would go out with executive approval. Bureau submissions, by contrast, were made by lower level staffers and the bureau couldn’t afford to wait for each to get official approval.  Official statistics, in other words, were built on estimates, compiled by underlings, and altogether unreliable in any individual case. When all mashed together, however, they generated official facts that proved broadly useful: to the government, in business, and to social scientists.</p>

<!---
See the testimony of Secretary Luther H. Hodges, in Committee on Post Office and Civil Service, Confidentiality of Census Reports: Hearings before the Committee on Post Office and Civil Service House of Representatives Eighty-Seventh Congress Second Session on H.R. 10569 and Similar Bills (Washington, D.C.: GPO, 1962), 5.
--->

<p><strong>The story of the secret file copies lays bare the haphazard magnificence of modern data systems. Thrown together with more or less care in all their jury-rigged splendor, they present powerful pictures of the world.</strong> Statistics may be a form of “thin description,” as Ted Porter <a href="https://www.jstor.org/stable/10.1086/667828">has argued</a>.  Still, “The drive for thinness, while often highly technical, is dense with human meaning and leads into unfathomable depths.”  Thin descriptions of the world, like the census forms, answer the questions asked by those who seek to know (and usually manage) how society works.</p>

<!---
Theodore M. Porter, “Thin Description: Surface and Depth in Science and Science Studies,” Osiris 27, no. 1 (2012) 209-226.
--->

<p><strong>They posit a reality and become, in their own way, real.</strong></p>

<hr />
<p>SOME LIMITS BUILT IN</p>

<p>Data systems generate models of society and when they take hold, it becomes difficult to see any difference between the model and what it represents. For that reason, it pays to change our situation, to try to find a way to see the system from the outside—or at least from the edges, from places that explicitly question the assumptions at the heart of the model.</p>

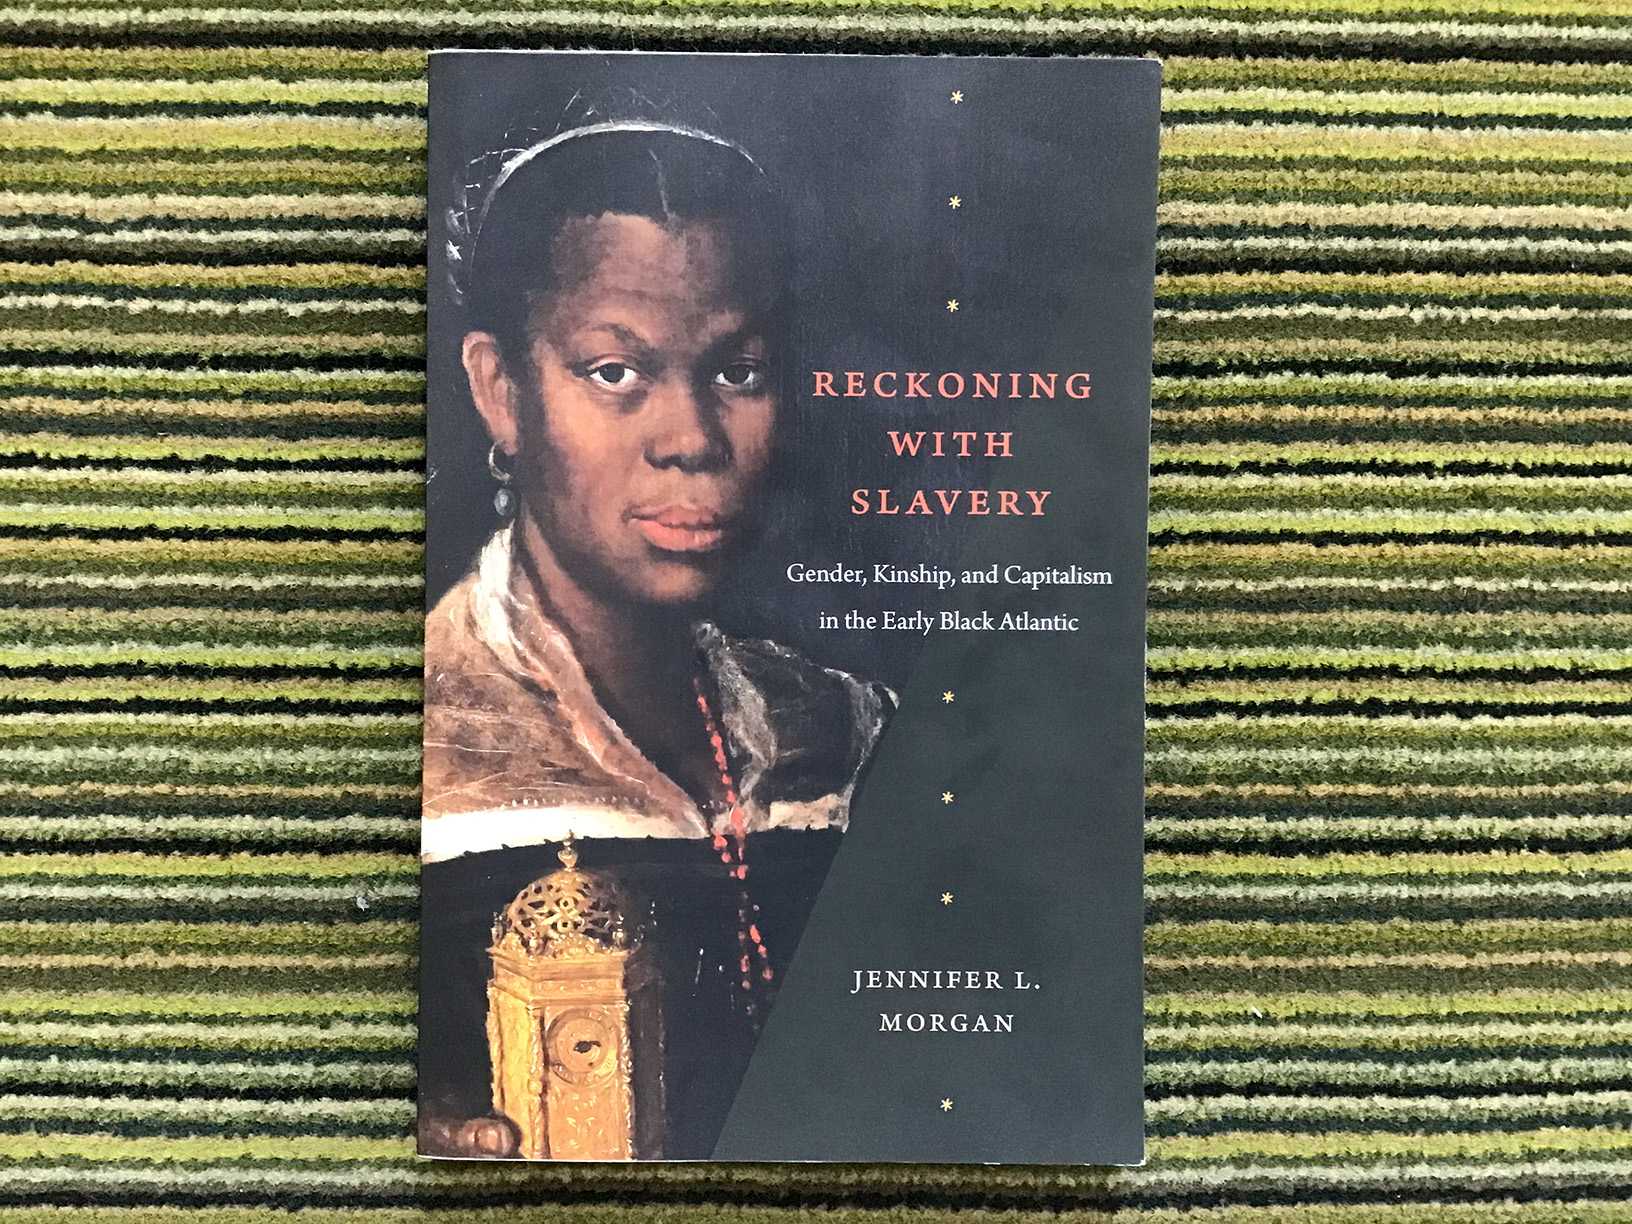
<p>The story of the birth of statistics and modern data systems usually starts in seventeenth century England, where a learned haberdasher (named John Graunt) wove reports of plague deaths into a grand picture of the course of disease. Yet this way of telling the story already obscures how much such data systems were being engineered to obscure. In her 2021 book, <a href="https://www.dukeupress.edu/reckoning-with-slavery"><em>Reckoning with Slavery</em></a>, Jennifer L. Morgan shifts the focus back further in time, to the sixteenth century, and away from Europe to Africa, and she asks readers to see the world through the eyes of women, rather than men.  These shifts each pose their own difficulties, precisely because the archives we have most ready access to today were constructed to such a history seem, in the Michel-Rolph Trouillot’s phrasing, <a href="https://www.beacon.org/Silencing-the-Past-P1109.aspx">“unthinkable”</a> and thus difficult to document.</p>

<!---
Michel-Rolph Trouillot, Silencing the Past: Power and the Production of History (Boston: Beacon Press, 1995, w/ 2015 preface), chapter 3.
--->

<p>Morgan has persevered, though, revealing how early modern colonial projects set definitions, accounting standards, and frames for thinking with that persist to this day. Some of the most important intellectual work in making modern facts possible involved writing off African practices and institutions. To take one crucial example, European writers asserted the failure of Africans to possess money or understand value, a market failure made manifest by the supposed insufficiency of the cowrie shell as currency. And yet, Europeans still somehow managed to use supposed non-functioning markets and definitely-not-money money to purchase enslaved people and fuel fledgling empires. Curious, that. (I’ve written more about this book <a href="https://www.shroudedincloaksofboringness.com/2022/06/06/reckoning.html">here</a>.)</p>

<p>At the same time, Europeans expanded dramatically their practices for putting people into ledgers, according to a fundamental distinction. Africans appeared in account books as people who could be bought and sold. Other people, who would come be to known as “white,” understood themselves as special precisely because they could not be sold. They defined their families according the love and care they showed their kin and the inviolability of their domestic ties, an inviolability cast in stark relief by the way the families of the enslaved could be ripped apart and by the enslavers’ denial (against all evidence) of even the possibility of maternal affection among the enslaved. Morgan argues, convincingly, that when the historian tries to stand in the place of enslaved women, the true limits of modern statistics stand out and we can see again more clearly how what has so long been called simply “rationality” along with dominant systems of accounting rested on the false premises of an emergent anti-Black racial capitalism.^</p>

<!---
For a continued investigation of the ways enslaved lives were manifested in ledgers, and evidence of the sophisticated data systems built for slavery, see Caitlin Rosenthal, Accounting for Slavery: Masters and Management (Cambridge, MA: Harvard University Press, 2018). Daina Ramey Berry resists the reduction of values to the singular perspective of enslavers in Daina Ramey Berry, The Price for Their Pound of Flesh: The Value of the Enslaved, from Womb to Grave, in the Building of a Nation (Boston: Beacon Press, 2017).
--->

<p>Back in England, the printed tables of statistical innovators presented productive illusions of order and mastery, over plague in the case of Graunt, or over transatlantic colonial projects as depicted by Virginia Company pamphlets. In <a href="https://mitpress.mit.edu/9780262039048/numbered-lives/"><em>Numbered Lives</em></a>, Jacqueline Wernimont, draws out the emotional and rhetorical power hidden behind the supposed unfeeling numbers of mortality bills and Graunt’s fold-out summary table of casualties or the tables of sums printed to fund the settlement of Virginia. Those who turned to tables as a new, modern form of data visualization did so in a way that called attention to and sought the attention of white men, especially those able to fight or willing to spend. “The aesthetic rationalism of Atlantic colonial accounts helped procolonialists render the often-violent and dangerous settler life as beautiful and controlled” writes Wernimont, and that “arithmetic sublime” further allowed company promoters to transmute unruly adventures broad into a neatly quantifiable opportunity for investment.  From their founding era, modern western data systems built a reality, piecemeal, in a hodge-podge, in an expression of the value of some lives over those of others.</p>

<p>One result of proliferating thin description has been an enormous outpouring of feeling and ensuing action: just think about what entire nations have done in the twentieth century for the sake of GDP. That is one of the insights driving Michelle Murphy’s investigations in <a href="https://www.dukeupress.edu/the-economization-of-life"><em>The Economization of Life</em></a>. For Benedict Anderson, modern nationalism became possible through print capitalism, which allowed for the widespread construction of an “imagined community.” Imagined, but still very real. The proof of that reality for Anderson was that people—so many people—fought and died in the name of nations.  As Murphy points out, measures of national income, when tied to models of population and economic growth, inspired mass sterilization across the world. Computer simulations taught postcolonial leaders to see money value in “averted births” and economic dashboards gave material form to “quantification and social science methods to calibrate and then exploit the differential worth of human life for the sake of the macrological figure of ‘economy.’”  In the end, and down to this day, asks Murphy: “What has not been done for GDP?”</p>

<p>Sustained examinations of data systems from their edges expose the vast social spaces and perspectives that they leave out.^^  At the same time, critical inquiries into the history of data highlight the way such systems have shaped lives and societies, often noting the way that access, opportunity, and surveillance play out differently according to race, class, gender, religion, sexuality, or other relevant categories of difference. These avenues of inquiry can give the wrong impression and can falsely amplify the capacities of a data system to do what it claims to do, unless the system’s promises are themselves treated with a healthy skepticism.</p>

<hr />
<p>ALWAYS JUST GETTING BY</p>

<p>In a <a href="https://www.nytimes.com/2022/10/07/podcasts/transcript-ezra-klein-interviews-adam-tooze.html">2022 podcast episode</a> from the US-based New York Times, the popular journalist and commentator Ezra Klein sought support from the historian and public intellectual Adam Tooze. Wasn’t the world of today simply too complex to be understood by statistics? Hadn’t something fundamental shifted, leaving an unbridgeable gap between reality and our capacities to represent societies and economies? “Some of these systems,” said Klein, “are now more complicated than human minds can fully grasp.”</p>

<p>Tooze rejected the premise. It seemed to Tooze that Klein was just giving up by asserting a fundamental and unconquerable unknowability that must therefore limit the actions of governments and the judgments of pundits.  He suggested Klein’s position shared important features of a form of critique popularized by Friedrich Hayek in the middle of the twentieth century: in Hayek’s judgment, central state planners ran on hubris, making policy on unsupportable knowledge claims, while robbing authority from the one system that really could process the complexity of the social world, the price-driven market economy.^^^^  Klein demurred: “I don’t think I’m as fatalistic as where you could take that.”</p>

<p>Klein’s approach seems to me a likely outcome in societies that tout data-driven objectivity (or “evidence-based policymaking”) without building a robust theory and history of how objective data have been made and have worked in the world. His is one of a handful of common means by which a brittle faith in data can fracture, crumbling in the face of the evidence of error, bias, or uncertainty. And the beneficiaries of that analytical fragility seems likely to be those who already had the most power, money, and data.^^^^^</p>

<p>This exchange among notable opinion-makers in an elite American milieu suggests a possibly surprising reason for the critical approach this essay has so far employed: those who use and rely on social scientific facts should understand that they have always been built from incomplete materials, and yet have often still served important purposes. It is not the case, as Klein suggested, that social or economic systems are only now too complex for our minds to grasp. They always have been.</p>

<p><strong>The interesting thing is to understand how governments, businesses, scholars, and activists have built nonetheless built bodies of data from which they could act in an always-too-complicated world.</strong> In a 2008 essay titled <a href="https://cgt.columbia.edu/research/papers-and-research/trouble-with-numbers-statistics-politics-and-history-in-the-construction-of-weimars-trade-balance-1918-1924/">“Trouble with Numbers,”</a> Tooze already pointed in this general direction, acknowledging the landmark scholarship of those who called into question the simple objectivity of statistics, and then calling for more work to tells the stories behind particular numbers that made a difference in the world. He wrote: “We should overcome our inhibitions and move from a generalized history of statistics as a form of governmental knowledge to a history of the construction and use of particular facts.”</p>

<!---
Adam Tooze, “Trouble with Numbers: Statistics, Politics, and History in the Construction of Weimar’s Trade Balance, 1918-1924,” American Historical Review 113, no. 3 (2008): 678-700 at 684. Among those who had already reframed statistics as a governmental knowledge were key texts by Desrosieres and Porter: Alain Desrosieres, The Politics of Large Numbers: A History of Statistical Reasoning (Cambridge: Harvard University Press, 1998); Theodore M. Porter, The Rise of Statistical Thinking 1820– 1900 (Princeton, NJ: Princeton University Press, 1986); Theodore M. Porter, Trust in Numbers: The Pursuit of Objectivity in Science and Public Life (Princeton, 1995). These discussions ran alongside and sometimes intersected with a move to historicize objectivity. See Lorraine Daston and Peter Galison, “The Image of Objectivity,” Representations 40 (Autumn 1992): 81-128; and Lorraine Daston and Peter Galison, Objectivity (Brooklyn: Zone Books, 2007).
--->

<p>Or, casting the net a bit more broadly: we should be (and are) writing histories of entire data processes, the circumstances that produced them, and their consequences in making social or economic systems tangible and manipulable.^^^^^^</p>

<hr />
<p>MORE THAN NUMBERS, OR, A PARADE OF AVALANCHES</p>

<p>The history of any particular number or fact tells one very important part of the story of how a data system responds to and remakes the world. A history centered on printed or digitized final figures offers one “cut” the historian can make, to borrow an approach from the STS scholar Karen Barad. <a href="https://www.dukeupress.edu/meeting-the-universe-halfway">Barad’s work</a> draws its inspiration from Niels Bohr’s quantum interpretations, where Bohr’s theory of complementarity argued that the incapacity to remeasure both momentum and position precisely (as is described in Heisenberg as an epistemological problem) was really a fundamental issue of experimental design: the measuring instruments that could see momentum were different from those that could see position. In Barad’s expansive interpretation, Bohr’s theory offers a way of understanding all scientific work, wherein the tools used for measuring are part of the system that generates any particular phenomenon. We can understand the world precisely, but only by acknowledging the ways our tools of measurement are actively constituting that world.</p>

<p>Instruments for generating statistics or social scientific facts are often very large, extending throughout a society being measured. To understand society, we should look closely at the ways the entire measurement instrument generates different forms or stages of data, from the moment of design to the relative chaos of collection to the centralized control exerted by data cleaners and on to a cacophony of post-publication interpretations. (I apply this model to the US census in <a href="https://www.shroudedincloaksofboringness.com/democracysdata/"><em>Democracy’s Data</em></a>)</p>

<p>A statistical study generates aggregates, published as numbers, charts, or maps. It also simultaneously creates new ways of defining individuals or describing relations among individuals. This was one of the crucial contributions of the recently departed philosopher Ian Hacking to the history of quantification. In a 1982 essay, “Biopower and the Avalanche of Printed Numbers,” Hacking built on and expanded the theories of Michel Foucault to explain why historians identified an efflorescence of statistical theory in the middle of the nineteenth century.</p>

<p>He began his answer by pointing to an often overlooked precondition: before the math and methods came a looming mounting of data. To explain where all that data came from Hacking identified a kind of spiraling process: first, bureaucracies get worried (about disorder, revolution, you name it) and set commissions that in turn produce reports filled with numbers. From those numbers, analysts discover “laws” and look more data, inspiring new bureaucracies to manage in accordance with those, and those bureaucracies generate more reports and more data and soon enough new laws and categories and worries. Then comes, you guessed it, more data. In an even more famous 2006 essay called <a href="https://www.lrb.co.uk/the-paper/v28/n16/ian-hacking/making-up-people">“Making Up People,”</a> Hacking emphasized the ways that this statistical cycle could create new kinds of people.  But well over 20 years earlier, Hacking’s theory of the avalanche already encompassed the fact that counting entailed the mass production of individual identities alongside social facts.</p>

<p>Hacking began his story with a great numerical avalanche in 1820s Europe. Such a periodization fits best when one is trying to explain, as Hacking was, European statistical theories closely related to human social and psychological behavior. One contest Hacking offered were debates among his contemporaries over what should and should be listed in the Diagnostic and Statistical Manual.</p>

<p><strong>But we would be better off imagining the history of data and social science as a series of avalanches, and they began well before the nineteenth century.</strong></p>

<p>There was the sixteenth century’s plague-counts and colonial outpourings, as I discussed in the context of Morgan and Wernimont’s books. William Deringer in <a href="https://www.hup.harvard.edu/catalog.php?isbn=9780674971875"><em>Calculated Values</em></a> identified an avalanche of numbers (printed in bickering political pamphlets) brought on eighteenth-century parliamentary outsiders trying to corral the ruling party in Britain.</p>

<p>And well after Hacking’s historical window the avalanches have kept on coming, taking on many different forms. <a href="https://www.hup.harvard.edu/catalog.php?isbn=9780674976283">Eli Cook</a>, for instance, has argued that the sorts of “moral statistics” that Hacking considered were merely one cascade of numbers following on earlier American efforts at quantifying household production and preceding a turn back toward economic concerns, this time fixated on cotton and capital.  The era of international fairs, following London’s Crystal Palace exhibition, elicited its own floods of official numbers and colorful charts, driven too by what <a href="https://press.uchicago.edu/ucp/books/book/chicago/M/bo114655831.html">Autumn Womack</a> calls a “survey spirit” emanating from settlement houses in poor neighborhoods.  National income accounting, which we already touched on with Murphy, was made possible in part by the rise of corporations, which generated the centralized paper work that could make such calculations possible, <a href="https://deepblue.lib.umich.edu/handle/2027.42/120713">argues Daniel Hirschman</a>.  Growing state capacity also made new kinds of calculations possible, as Emmanuel Didier shows in his reconstruction of agricultural and employment figures as put together by the New Deal administration.  The United Nations spurred an mid-twentieth-century program to expand censuses across the world, as <a href="https://global.oup.com/academic/product/building-the-population-bomb-9780197558942">Emily Merchant reveals</a>.  <a href="https://press.princeton.edu/books/hardcover/9780691179476/making-it-count">Arunabh Ghosh’s account</a> of one of the largest (though Soviet-inspired) censuses, in China, points to another grand and very complicated rush of numbers.  Amid these massive state-led operations, the peculiar project that <a href="https://yalebooks.yale.edu/book/9780300209525/database-of-dreams/">Rebecca Lemov called “the Database of Dreams”</a> stands out still for its ambitions, if not for its accomplishments.</p>

<p>Elizabeth Popp Berman’s <a href="https://press.princeton.edu/books/hardcover/9780691167381/thinking-like-an-economist"><em>Thinking Like an Economist</em></a> recounts a budgetary avalanche. Belt-tightening brought on the war in Vietnam inspired a planning and budgeting system. It has mixed effects in terms of trimming costs or guaranteeing effective policy, but it succeeded magnificently in spreading offices equipped to make economic calculations throughout the government and the private sector.  This empire of economists might well be said to have reached its maturity at precisely the moment that a historian of science published a book trying to explain why so many institutions had appeared to cede judgment to quantification. Porter’s <a href="https://press.princeton.edu/books/paperback/9780691208411/trust-in-numbers"><em>Trust in Numbers</em></a> offered a classic and persuasive argument that weak bureaucrats in democratic governments were particularly likely to turn to mechanical decision criteria.  Yet there’s a different explanation for why Porter asked the question in the first place, and for why some AI decision systems continue to be so alluring: it begins with an avalanche of budgetary numbers.</p>

<hr />
<p>Thank you to Jamie Cohen-Cole for inspiring this essay and to Joanna Radin for early conversations that shaped it.</p>

<hr />
<p>Some notes…
^For a continued investigation of the ways enslaved lives were manifested in ledgers, and evidence of the sophisticated data systems built for slavery, see Caitlin Rosenthal, <a href="https://www.hup.harvard.edu/catalog.php?isbn=9780674972094"><em>Accounting for Slavery: Masters and Management</em></a> (Cambridge, MA: Harvard University Press, 2018). Daina Ramey Berry resists the reduction of values to the singular perspective of enslavers in Daina Ramey Berry, <a href="https://www.penguinrandomhouse.com/books/538529/the-price-for-their-pound-of-flesh-by-daina-ramey-berry/"><em>The Price for Their Pound of Flesh: The Value of the Enslaved, from Womb to Grave, in the Building of a Nation</em></a> (Boston: Beacon Press, 2017).</p>

<p>^^Of course, limits are necessary to the knowledge making process. The important question for the historian and the activist alike is to understand the limits of an existing system with precision and to investigate how those limits came to be.</p>

<p>^^^For a fascinating parallel case, consider the complex social and technological negotiations that went into getting London stock prices out on ticker tape machines. See John Handel, <a href="https://www.cambridge.org/core/journals/enterprise-and-society/article/material-politics-of-finance-the-ticker-tape-and-the-london-stock-exchange-1860s1890s/7BA79594BE371FBD270D7C0D701F2B33">“The Material Politics of Finance: The Ticker Tape and the London Stock Exchange, 1860s-1890s,”</a> Enterprise and Society 23, no. 3 (2022): 857-887.</p>

<p>^^^^On Hayek’s approach and the multifarious, transnational threads that formed in mid-century to critique planning, see Angus Burgin, <a href="https://www.hup.harvard.edu/catalog.php?content=reviews&amp;isbn=9780674503762"><em>The Great Persuasion: Reinventing Free Markets since the Depression</em></a> (Cambridge, MA: Harvard University Press, 2012).</p>

<p>^^^^^See Naomi Oreskes and Erik M. Conway, <a href="https://www.merchantsofdoubt.org/"><em>Merchants of Doubt: How a Handful of Scientists Obscured the Truth on Issues from Tobacco Smoke to Global Warming</em></a> (New York: Bloomsbury Press, 2010); Robert N. Proctor and Londa Schiebinger (eds.), <a href="https://www.sup.org/books/title/?id=11232"><em>Agnotology: The Making and Unmaking of Ignorance</em></a> (Stanford, CA: Stanford University Press, 2008).</p>

<p>^^^^^^This might sound a bit like a theory of “performativity,” and to an extent it is. But it takes the performativity observed in recent financial markets to be merely a species of how statistics and data systems generally work: Donald MacKenzie and Yuval Millo, <a href="https://www.jstor.org/stable/10.1086/374404">“Constructing a Market, Performing Theory: the Historical Sociology of a Financial Derivatives Exchange,”</a> American Journal of Sociology 109:1(July, 2003): 107-145.</p>]]></content><author><name></name></author><summary type="html"><![CDATA[Last year, some smart people asked me to write a review essay about data in the history of the social sciences. I tried. I did. But it turned out I didn’t have it in me. Such an undertaking requires the writer to float high above the terrain, describing its contours. Yet what interests me most is thinking about how to crouch close to the ground. So, what follows is an essay about a stance for thinking about data and the way we know what know about modern societies.]]></summary></entry><entry><title type="html">A Wary Wander into ChatGPT, with Opt-Out Instructions</title><link href="https://www.shroudedincloaksofboringness.com/2023/08/16/chatgpt.html" rel="alternate" type="text/html" title="A Wary Wander into ChatGPT, with Opt-Out Instructions" /><published>2023-08-16T04:16:35+00:00</published><updated>2023-08-16T04:16:35+00:00</updated><id>https://www.shroudedincloaksofboringness.com/2023/08/16/chatgpt</id><content type="html" xml:base="https://www.shroudedincloaksofboringness.com/2023/08/16/chatgpt.html"><![CDATA[<p>My child and I are sitting on the third floor of McGill’s Redpath library, surrounded by books about art and architecture. Today, we’ve decided to attempt a foray into ChatGPT, one that we’re going to try to do in a way that does as little harm as possible.</p>

<p>It is 11:16am in Montreal, and we begin by navigating our browser to https://chat.openai.com/auth/login</p>

<p>Against a simple black background, we are presented with just this message: “Welcome to ChatGPT” and then “Log in with your OpenAI account to continue.” We can either “Log in” or “Sign up.” I guess we have to sign up. (I have already previously clicked on the very small “Terms of use” and “Privacy policy” links at the very bottom of the page.)</p>

<p>I am asked to give my name and my birthday. I could lie, but I have already given them my real e-mail address in order to log in. So I don’t see the point in subterfuge. It asks for my age (it claims this is only to verify that I am 13 years or older, but the child and I are skeptical). The page also informs me that by clicking “continue” I am agreeing to the terms and privacy policy.</p>

<p>I click.</p>

<p>Now it demands I also give my phone number, so that it can send me a code. My cell tells me 033347, which the child enters for me, giving me a hard time for not remembering it immediately. Kids these days.</p>

<p>We’re in, and the systems informs us that this is a ‘free research preview.” We’re guinea pigs and they want us to help them “improve [their] systems and make them safer.” There’s a disclaimer too. It says “While we have safeguards in place, the system may occasionally generate incorrect or misleading information and produce offensive or biased content. It is not intended to give advice.” So, I guess I won’t ask it for advice.</p>

<p>We click “next.”</p>

<p>This screen is labeled “How we collect data.” It says that “AI trainers” might be looking at these conversations: the icon here is a little metal robotic arm, with an undeniable bicep. So the anthropomorphizing is strong here. It warns us not to “share any sensitive information,” which seems like good advice on the internet generally. This screen doesn’t inform me that I can Opt-Out of data collection.</p>

<p><img src="/images/chatgpt_robot_bicep.jpg" alt="a screenshot showing a robotic bicep meant to depict an &quot;AI trainer&quot;" /></p>

<p>“Next.”</p>

<p>They want us to grade the responses and let us know if they’re helpful. There’s a discord server. Nothing about opting out.</p>

<p>“Done.”</p>

<p>The introductory page gives us three examples, it lists three “capabilities” (memory of conversation, follow-up queries, and guardrails), and then three “limitations.” What we learn from ChatGPT-3.5 maybe incorrect, harmful, biased, and with limited knowledge anything after 2021. Okay.</p>

<p>As the child points out, they’re attempting the up-sell already. We have access to 3.5. The version GPT-4 has a lock icon. Another section that says “upgrade to plus” informs us that for $20 a month, we can get access to GPT-4.</p>

<p>I scope out the settings before we ask any questions. I’m still looking for any mention of opting out. The first option in settings is “General” and I can choose a theme or I can “clear all chats,” which erases the chats from our session, but not from the company’s logs.</p>

<p>Under the next tab, “Data controls” we see a prominent option labeled ‘Chat history &amp; training.’ This looks like the opt-out option. If we leave the switch, by default on, then we’re agreeing to “save new chats on this browser to your history and allow them to be used to improve our models.” If we flip the switch, which I do, we’re warned that “Unsaved chats will be deleted from our systems within 30 days.” It is not clear if this is opting out.</p>

<p><img src="/images/chatgpt_optout_settings.jpg" alt="a screenshot of a settings dialog for &quot;data controls&quot;" /></p>

<p>I have dug through the OpenAI website, following breadcrumbs into the company blog, to an entry called <a href="https://help.openai.com/en/articles/5722486-how-your-data-is-used-to-improve-model-performance">“How your data is used to improve model performance.”</a>  It says this:</p>

<blockquote>
  <p>“You can switch off training in ChatGPT settings (under Data Controls) to turn off training for any conversations created while training is disabled or you can submit this form. Once you opt out, new conversations will not be used to train our models.”</p>
</blockquote>

<p>Just to be safe, we’re filling out <a href="https://docs.google.com/forms/d/e/1FAIpQLScrnC-_A7JFs4LbIuzevQ_78hVERlNqqCPCt3d8XqnKOfdRdQ/viewform">the form</a> too.</p>

<p>The opt-out form is doing its best to convince me to let them use my data. This is about “continuous improvement” of the system. And they are assuring my privacy: they will “remove any personally identifiable information from data we intend to use to improve model performance.” But that doesn’t help if the thing I don’t want to do is help them make their system more powerful.</p>

<p>Finally, they warn me that by not allowing training, it “will limit the ability of our models to better address your specific use case.” I can live with that.</p>

<p>We fill out the form. It involves clicking over to get an “organizational ID” for our “personal account.” We are told that our opt-out has been processed, but then there’s nothing else. The google form sent me a copy of my opt-out request. I don’t get any other obvious signal that it worked…</p>]]></content><author><name></name></author><summary type="html"><![CDATA[My child and I are sitting on the third floor of McGill’s Redpath library, surrounded by books about art and architecture. Today, we’ve decided to attempt a foray into ChatGPT, one that we’re going to try to do in a way that does as little harm as possible.]]></summary><media:thumbnail xmlns:media="http://search.yahoo.com/mrss/" url="https://www.shroudedincloaksofboringness.com/images/chatgpt_optout_settings.jpg" /><media:content medium="image" url="https://www.shroudedincloaksofboringness.com/images/chatgpt_optout_settings.jpg" xmlns:media="http://search.yahoo.com/mrss/" /></entry><entry><title type="html">#NYCPride, data systems edition</title><link href="https://www.shroudedincloaksofboringness.com/2023/06/30/nycpride.html" rel="alternate" type="text/html" title="#NYCPride, data systems edition" /><published>2023-06-30T04:16:35+00:00</published><updated>2023-06-30T04:16:35+00:00</updated><id>https://www.shroudedincloaksofboringness.com/2023/06/30/nycpride</id><content type="html" xml:base="https://www.shroudedincloaksofboringness.com/2023/06/30/nycpride.html"><![CDATA[<p><a href="https://www.whitehouse.gov/wp-content/uploads/2023/01/Federal-Evidence-Agenda-on-LGBTQI-Equity.pdf"><img src="/images/lgbtqi_datatypes.png" alt="Data Types: Quantity, Quality, and Understanding What Works" /></a></p>

<p>Last Sunday was the NYC pride march, which I celebrated (as one does) by digging into my pile of reading on queer data.</p>

<p>First, I opened up the Biden administration’s <a href="https://www.whitehouse.gov/wp-content/uploads/2023/01/Federal-Evidence-Agenda-on-LGBTQI-Equity.pdf">Federal Evidence Agenda on LGBTQI+ Equity.”</a> The report was put together by a subcommittee of the National Science and Technology Council with a focus on explaining how best to gather and use “SOGI” data. SOGI is widely used short-hand for sexual orientation and gender identity.</p>

<p>It turned out to be surprisingly good. Really: I was not looking forward to this report, but then I kept saying to myself, “ooh, that’s a neat way of thinking about that.” So I’ll share a few of the neat things here.</p>

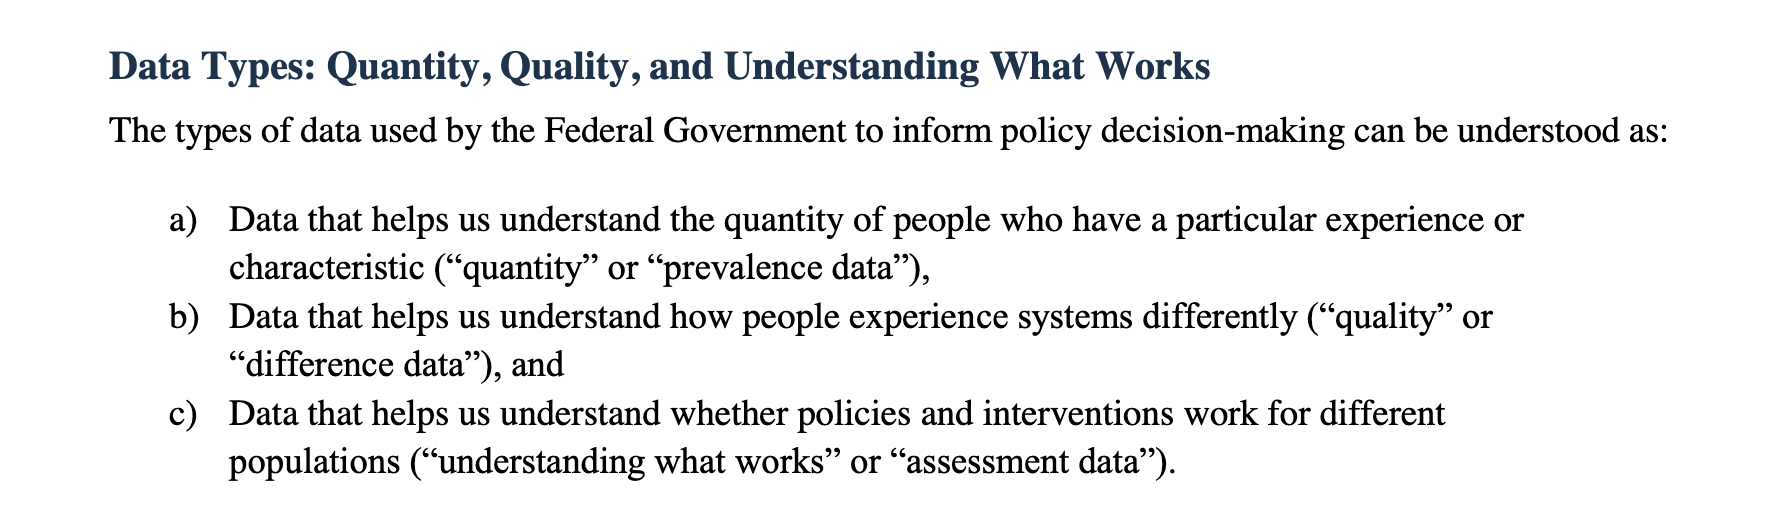
<p>Early on, the report offers a taxonomy of data types. First, there’s “prevalence data” which establishes a sense of how many LGBTQI+ people there are in any given time and place. Next, there’s “difference data” intended to highlight the distinct experiences of queer folk and the challenges they face. Finally, there’s “assessment data,” which is (ideally) where you look for clues on how to make systems and policies that actually work to improve those experiences and overcome existing challenges.</p>

<p>Prevalence data is literally fundamental. It’s essential to know how many queer people there are if one hopes to make reasonable comparisons, to calculate rates per person, or to use sampling techniques for focused investigations.</p>

<p>In my response to the subcommittee’s initial call for comments, I argued that the decennial census needs more robust SOGI questions because of its key role in establishing prevalence baselines:</p>
<blockquote>
  <p>Visibility in the census is of paramount importance precisely because it also enables further statistical investigation. Census data provide the reference frame for representative sample surveys, for instance. Better SOGI census data will allow for other SOGI surveys to be run at smaller scales that limit the number of people whose days are interrupted to answer questions that can feel invasive and also to limit the amount of sensitive data collected about individuals.</p>
</blockquote>

<p>As the report moves to “difference data,” it makes the case for looking at LGBTQI+ status as a variable by calling attention to a startling example. The authors cite a study showing that in the US “40 percent of those young people [under 18] experiencing homelessness identify as LGBTQI+—a much higher rate than estimates of prevalence in the general population.” I did not know that. But now that I do, I certainly agree it would be wise to adjust our responses to homelessness among young people.</p>

<p>Next, the report argues for “prioritizing assessments of programs and services for LGBTQI+ people in areas where known disparities exist, such as in education, housing, caregiving, employment, immigration, and military life.” It continues by noting that “Many of these assessments will rely on administrative data.”</p>

<p>It seems hard to argue with the goal of finding out what policies are working well for queer people. But “assessment” makes me queasy (like “efficiency”), probably because it has so often been tied to efforts to cut or constrain—and because things that are hard to assess with data can then become vulnerable.</p>

<p>An anecdote from Ellen Ullman’s <a href="https://us.macmillan.com/books/9781250884121/closetothemachine25thanniversaryedition"><em>Close to the Machine</em></a> comes to mind here. Ullman, a computer programmer and essayist, signs up to help a nonprofit build “Jerry,” a system intended to make it easier to coordinate care and service provision for AIDS patients. It turns out to be a disconcerting experience.*</p>

<p>“Two months into the planning of the second phase, the project took a distinctly ‘bad’ turn,” wrote Ullman. “The director of the department began asking for links between client registration data and other city systems.” The administrator hoped to use the data to measure efficacy and cut slack from the system. Ullman thought there was value in the existing imprecisions that ought to be maintained:</p>
<blockquote>
  <p>“How would it help clients if Jerry told her that this particular underfunded agency should be even more underfunded?…How would it help if, in the awful and explicit way of computer systems, Jerry made clear what everyone knew—that there was a little fudging going on around the edges, so that providers could get a little extra and give a little more. In the absence of the machine, everyone could wink at these small rough edges.”</p>
</blockquote>

<p>So, I guess I’m arguing for assessment in the spirit of maintaining some useful slack.</p>

<p>The final thing I’ll say about the report pertains to its approach to the problem of getting good statistics about small-ish communities. By “good statistics” I mean numbers that are useful and not too misleading: that requires a certain amount of disaggregation. Lumping together all LGBTQI+ people ends up hiding variations that can be crucial. But the more one disaggregates a data set, the more likely that the analysis will reveal confidential, individual data (which is a bad thing) or will fail to benefit from the law of large numbers (and so the results might not be reliable).</p>

<p>The basic solution, as the report explains, is to make the sample bigger: if one narrows a dataset to look solely at the experiences of non-binary people, for instance, then one may need to look at a greater window of years or include a larger geographic region. As the report puts it: “To address the limitations of small population data, multiple agencies and data sources collecting similar information at varying time intervals, granularity, and geography may need to pool data to allow for more accurate analyses and interpretation of results.” The authors draw inspiration from strategies employed to conduct disaggregated research among similarly prevalent groups within Asian American and Native Hawaiian and Pacific Islander communities.</p>

<p>It is, as I said, a more interesting report than I expected. I’ll close this section by looking back at that Ellen Ullman example, though, just to note that more data to highlight problems becomes useful when our society also agrees to devote more resources to addressing those problems. Shrinking the pie or even just maintaining it—whether that pie is the amount of affordable housing or access to healthcare or education—can undermine the power of gathering good data in the first place, and the data itself can end up as a tool employed to further trim away much needed slack. We have to ask for better data at the same time we push for a new, green, and inclusive deal for our society.</p>

<hr />
<p><br /></p>

<p>In my #NYCPride celebrating, I also picked up an article I had been meaning to read for a while, by one of the most important and original voices among historians of computers, <a href="https://marhicks.com/">Mar Hicks</a>. In a 2019 article, <a href="https://ieeexplore.ieee.org/document/8634814">“Hacking the Cis-tem,”</a> Hicks explained how their diligent FOIAing of British government pension-office documents had revealed a very early example of what we now call computerized algorithmic bias. The targets of that bias were trans Britons, who in the 1950s and 60s had negotiated a kind of deal with the pension office: if they agreed to a legal fiction that their birth certificates had simply been marked erroneously and won the support of some key witnesses (including usually a doctor), then the Ministry would issue a new National Insurance card indicating their proper gender. It wasn’t a perfect system, but it was something.</p>

<p>Then came a shift to more complete computerization.</p>

<p>If we lean toward liberatory narratives of computing, we would expect this transition would have been a good sign for trans people. If, other the hand, we start out with Ellen Ullman’s viewpoint, then we’d maybe be a bit suspicious about what might happen when a government decides to code a workable, informal system. And that is more in line with what Hicks found: a new commitment to binary sex embedded in binary code.</p>

<p>In the mid-1970s, Ministry officials stopped changing gender on ID cards claiming that the new system and the computers that made it possible no longer saw gender—they claimed, therefore, that the card’s gender indication no longer mattered. (This ignored the many ways that having one’s proper gender on a government ID would matter to a person.) The new system tracked income instead, increasing economic surveillance and tying pensions to earnings (as was already common in the American social security system). Still, Hicks reported, the system did not really give up on gender. The people who programmed the computers built in exceptions that flagged every person who the government knew to be trans, requiring each to have their case dealt with manually. By treating trans folk as exceptions, the government assured extra scrutiny and made delays more likely. Computerization offered an excuse to walk back trans-accepting policies, while hiding the system’s suspicion of Britons who didn’t submit quietly to the gender binary.</p>

<p>Alongside that cautionary tale, Hicks pauses to reflect on something else revealed in these FOIA files:</p>
<blockquote>
  <p>There were large enough numbers of trans Britons asserting their rights to the benefits of the new welfare state to be taken for granted as a class of citizen-users, had the state chosen to see them as such. Indeed, these files may contain some of the earliest examples of how trans citizens began to emerge as a specific cohesive class arguing for their rights in British society in the 20th century. (29)</p>
</blockquote>

<p>Here is an inspiring point. No one wants to spend time fighting to get their name or gender corrected in a pension ledger—that so many people did so is a testament to their resolve, and an expression of queer activism that deserves our celebration.</p>

<hr />
<p>FURTHER READING:</p>
<ul>
  <li>my one-time, beloved officemate at the MPI in Berlin, <a href="https://history.berkeley.edu/sandra-eder">Sandra Eder</a>, wrote <a href="https://lareviewofbooks.org/article/how-gender-went-rogue/">“How ‘Gender’ Went Rogue”</a> for <em>Los Angeles Review of Books</em>, an essay based on Sandra’s book <a href="https://press.uchicago.edu/ucp/books/book/chicago/H/bo156724705.html"><em>How the Clinic Made Gender</em></a>.</li>
  <li>last August, WIRED excerpted part of my chapter on “partners” in the census from <a href="https://bookshop.org/books/democracy-s-data-the-hidden-stories-in-the-u-s-census-and-how-to-read-them/9780374602543"><em>Democracy’s Data</em></a> in an essay titled <a href="https://www.wired.com/story/us-census-queerness-data/">“How Does Queerness Fit Into US Census Data?”</a></li>
</ul>

<p>*NOTE (appended on July 6, 2023): I was using the first Picador paperback edition when I wrote this post. When I got my copy of the new MCD/Picador 25th Anniversary Edition, I saw that the name of the system had changed to “Reggie”: “Reggie. Also short for registration.” My guess is that that the original name had been changed for some concern about privacy in earlier editions and is now, many years later, being revealed.</p>]]></content><author><name></name></author><summary type="html"><![CDATA[]]></summary><media:thumbnail xmlns:media="http://search.yahoo.com/mrss/" url="https://www.shroudedincloaksofboringness.com/images/lgbtqi_datatypes.png" /><media:content medium="image" url="https://www.shroudedincloaksofboringness.com/images/lgbtqi_datatypes.png" xmlns:media="http://search.yahoo.com/mrss/" /></entry><entry><title type="html">Toward A World Where We All Can Fall, and Get Back Up Again</title><link href="https://www.shroudedincloaksofboringness.com/2023/01/08/noaccidents.html" rel="alternate" type="text/html" title="Toward A World Where We All Can Fall, and Get Back Up Again" /><published>2023-01-08T04:16:35+00:00</published><updated>2023-01-08T04:16:35+00:00</updated><id>https://www.shroudedincloaksofboringness.com/2023/01/08/noaccidents</id><content type="html" xml:base="https://www.shroudedincloaksofboringness.com/2023/01/08/noaccidents.html"><![CDATA[<p><a href="https://www.simonandschuster.com/books/There-Are-No-Accidents/Jessie-Singer/9781982129668"><img src="/images/2023_Singer_NoAccidents.jpg" alt="Cover image for Jessie Singer's book *There Are No Accidents*" /></a></p>

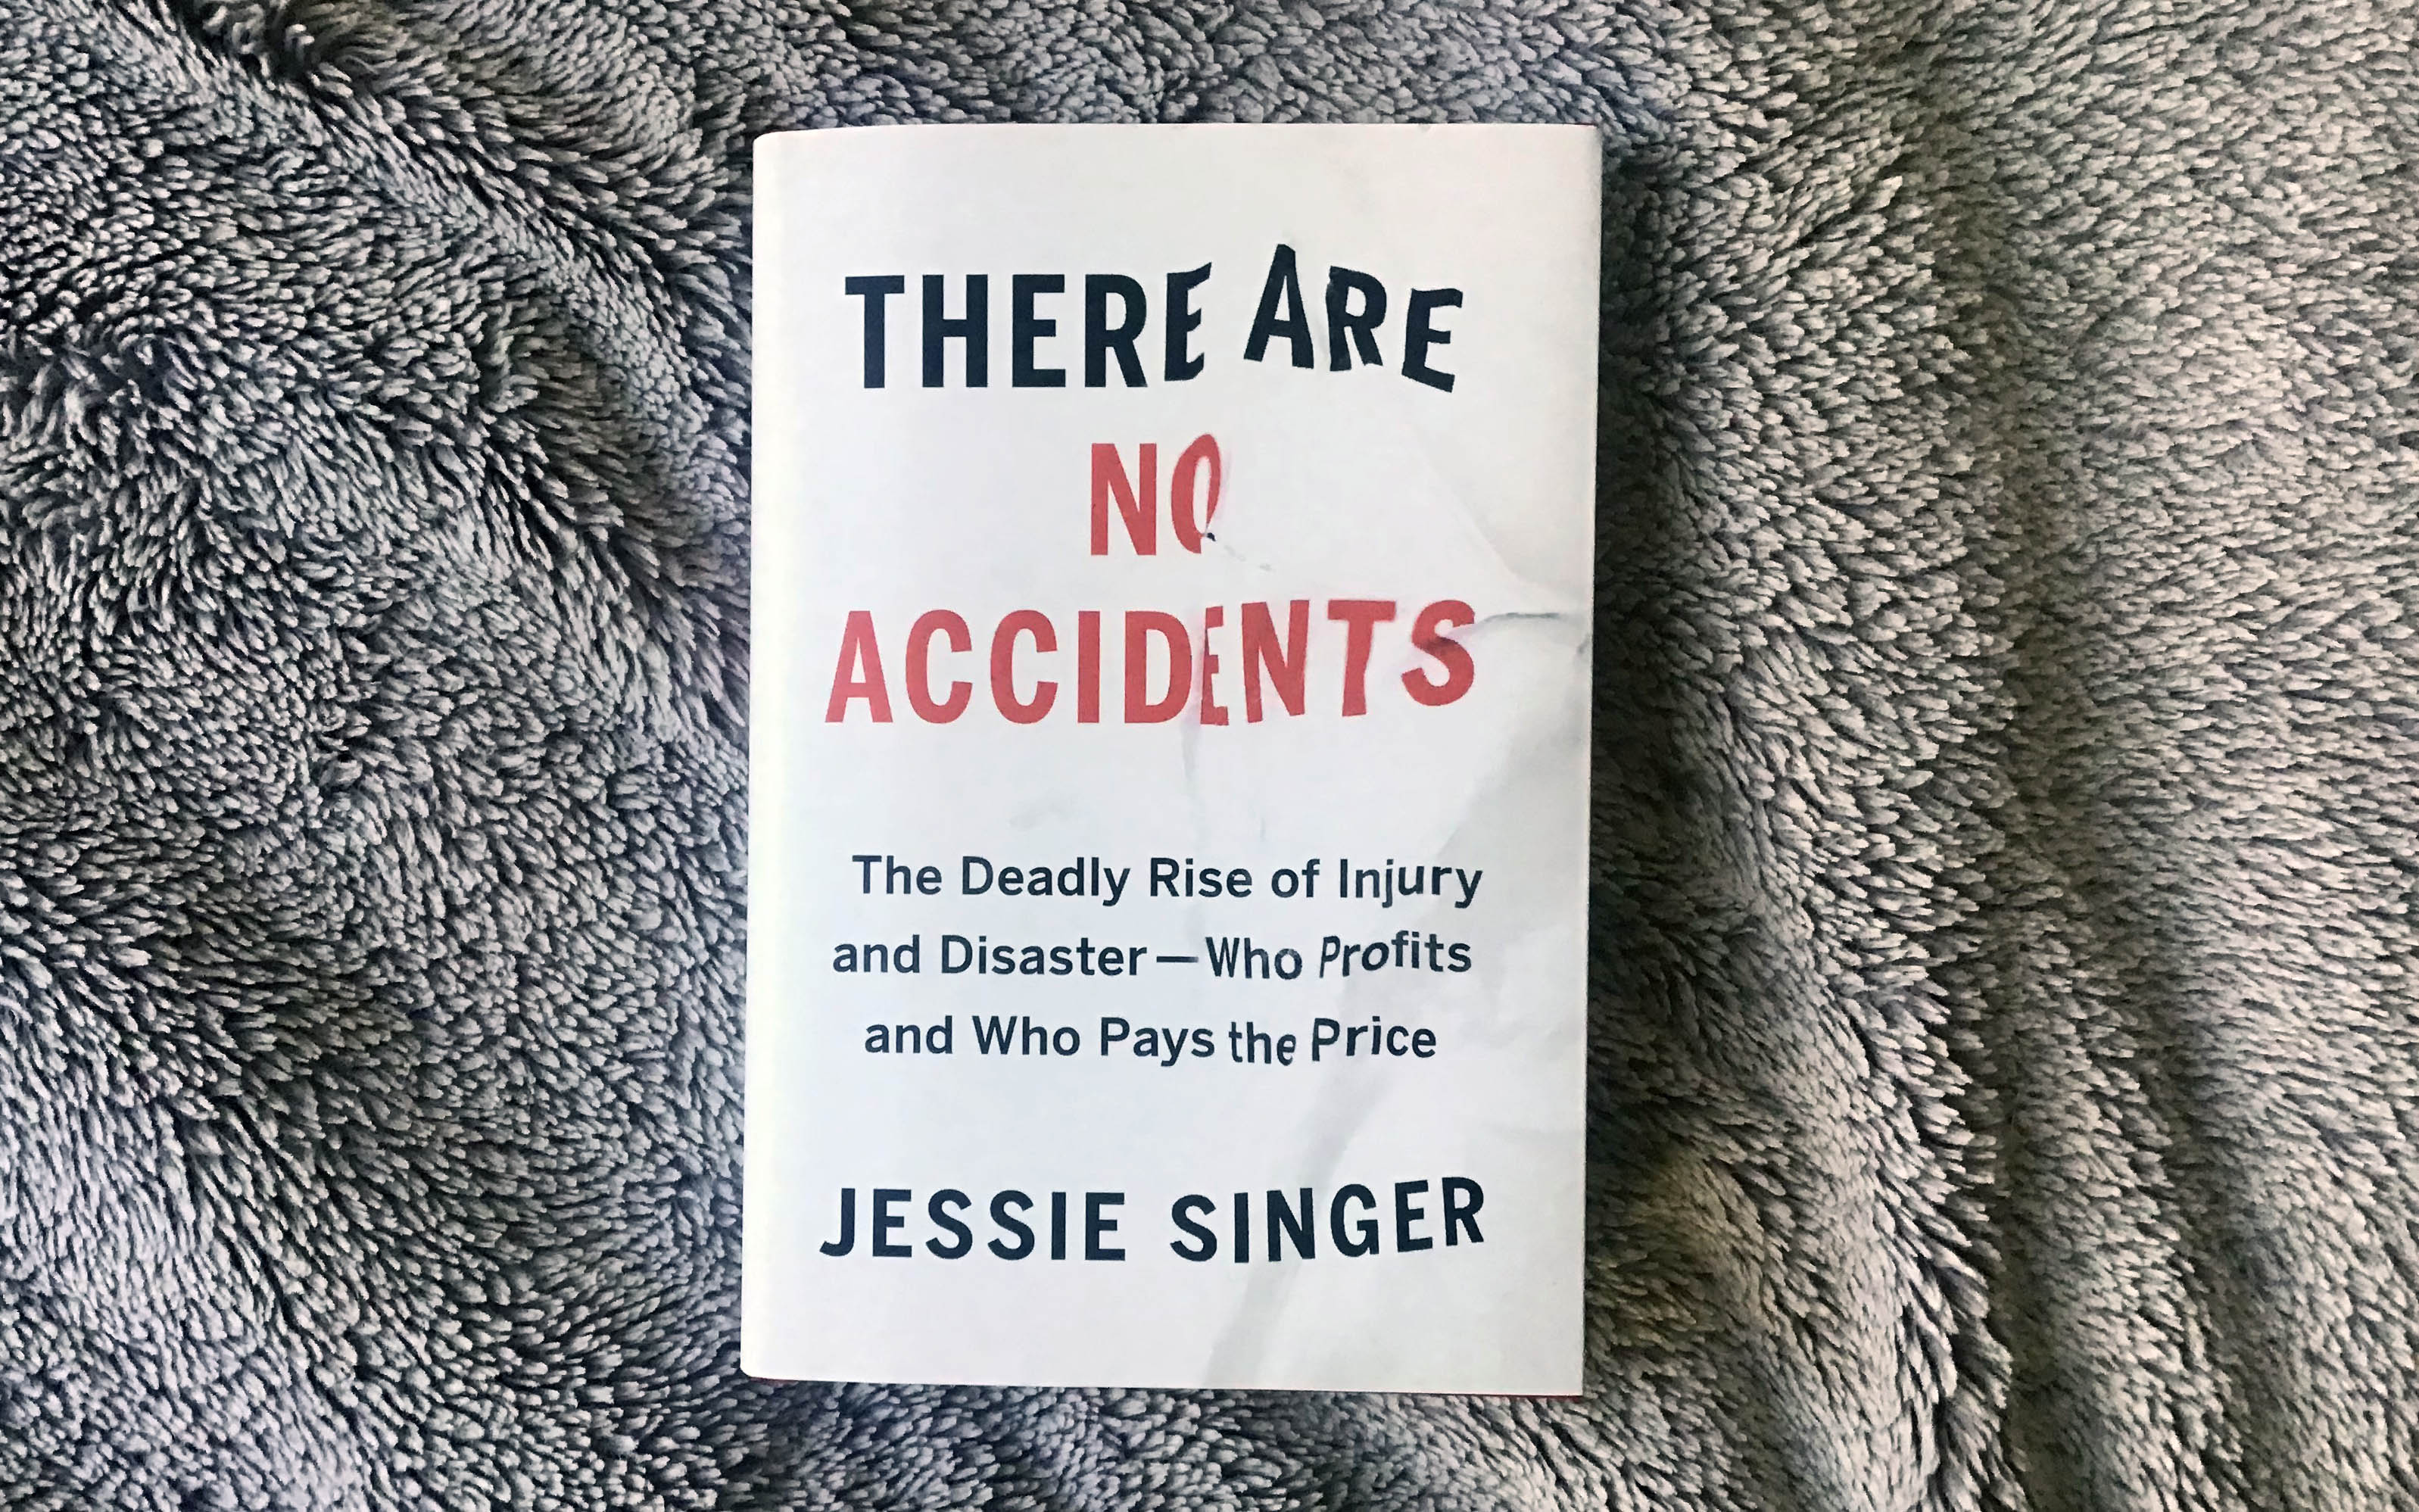
<p><a href="https://www.simonandschuster.com/books/There-Are-No-Accidents/Jessie-Singer/9781982129668"><em>There Are No Accidents</em></a> is a polemical title for a revolutionary book. At its core is this idea: We live in a world suffused with people who suffer from “accidents” because we live in a world with environments allowed to be, often built to be, dangerous. The book’s radical assertion is that unforeseen events do not necessarily cause excessive harm. <strong>In a properly designed system, things can go off the rails without actually going <em>off the rails</em>.</strong></p>

<p>Singer’s book focuses on unintended injuries and their various causes. And Singer approaches this topic as a smart, careful journalist. She has read—and duly, generously cites—academic literature on safety and <a href="https://www.press.jhu.edu/books/title/10758/risk">risk</a> from <a href="https://mitpress.mit.edu/9780262516129/fighting-traffic/">automobiles</a> to nuclear power-plants. There’s quite a bit of (to my mind) well-digested history herein, coupled with the voices of experts and activists who seek to make our world generally safer. Here I think I should stress that <strong>safer does not mean more boring.</strong> A good safe environment encourages risk taking. When a well-engineered fall won’t end in tragedy, there’s less reason not to jump.</p>

<p>Singer tells her own story—really the story of a beloved friend, Eric—to carry readers toward the revolution in worldview and spirit that the book seeks. Eric died when a driver in a car that was moving too fast struck him and his bicycle. As Singer watches the driver in court, sentenced to prison, she sees a man about to be taken away from his children just as Eric was from his own, and she does not feel like this is justice. Surely, the driver was to blame, but she argues that the blame would be better aimed at those who put cars moving fast and bicycles in close proximity, when they could have done otherwise. <strong>Those who make dangerous environments or allow them to persist are more to blame than those who more immediately bring a harm to fruition.</strong></p>

<p>And as Singer reveals, the terrible, “accidental” collision that took Eric’s life was actually one of multiple in the same small area of Chelsea, where a popular bike path came together with a major highway—long before Eric died, the city had been made aware by advocates that this was a dangerous environment, and it put off action. Only after a mortifying act of terrorism did city make the necessary fixes to safely separate bike traffic from speeding cars.</p>

<hr />

<p></p>
<p>Singer’s ethos resonated deeply with me. I was at first resistant to the title. I believe in “accidents,” by which I mean things that happen by chance. I believe, for that matter, that most of life is accidental, suffused with chance. As I read, though, I realized that Singer was up to something different. She too acknowledged the unpredictability of life. But she had discovered something in her studies: those who are the most well off somehow end up much more likely than others to survive life’s accidents. As she summarizes some of those findings:</p>

<blockquote>
  <p>Decades after the decisions to build or not build a train, people of color are more likely to lack an alternative to driving, walking, or biking on or near unsafe roads, and thus suffer the accidents that result …Accidents are a matter of being a certain person at a certain place at a certain time. Whiteness protects. And the one thing that can change the fate of the ‘accident prone’ is cash.</p>
</blockquote>

<p>We can acknowledge and even embrace chance, without resigning ourselves to deadly outcomes. We can celebrate chance and enjoy it together, the more we are committed to creating equitable, safe environments for everyone.</p>

<p>You, my dear reader, may feel that this is asking too much. I will freely admit it is a world-changing vision. It reminds me of a concept central to my own religious faith: grace. In my own heretical, vaguely Calvinist interpretations of Christianity, the central reality of existence is how deeply flawed it is and we are. The world is one where things go wrong, where people go wrong, all the time. “Lead us not into temptation,” the prayer implores, precisely because temptation is inevitable. “But deliver us from evil,” it continues, because after stuff goes sideways, we each need someone, something to catch us. (And let us not forget “forgive us our trespasses”!) Grace is a theological manifestation of a safe environment. With grace, people make mistakes, but divine forgiveness softens the fall. (And yes: I do therefore believe that Christians <em>should</em> love Singer’s vision. And no: I am not hopeful that most American churches actually will embrace it…but what if it they did?!?!)</p>

<p>This book resonated very deeply for me, striking a chord with my professional, professorial beliefs too. At one point while reading, I thought of Larry Summers, the former Treasury Department official and one-time President of Harvard. Many of you will remember what precipitated Summers’ departure from his Harvard presidency. In 2005, Summers <a href="https://www.thecrimson.com/article/2005/1/14/summers-comments-on-women-and-science/">spoke</a> at a National Bureau of Economic Research luncheon, and raised a question: what if the reason there were fewer women scientists was because women weren’t (as a group) as good at science as men?</p>

<p>I think Singer’s framework can encompass this sort of scenario. Summers, as president, was responsible for building an educational environment (along with many others). It was his job to help build an institution where students and faculty could go out on a limb and fall without cracking open their metaphorical skulls. It should be the job of a university to make it possible for all students to learn, and hopefully to succeed. When Summers tried to blame those whose heads were cracking (a cohort of women scientists who hadn’t been given a secure environment to succeed), he gave up on the entire project of educating everyone. He chose to blame people, rather than to re-engineer Harvard.</p>

<p>As you’re reading this, you may be bristling. I’ve struggled even to figure out how to write it, because these ideas run so powerfully counter to the prevailing ideology that I grew up with in eighties/nineties America. Of course, it is also thrilling. <strong>When we, as a society, decide that all people ought to be able to become scientists, regardless of gender, we can do that. When we, as a community, decide that people a right to safe housing and or a healthy workplace or walkways free of vehicular menace, that too is possible. It “just” takes the collective will to devote necessary time and resources to make such a change possible.</strong> But to not devote such resources, is to choose instead some other set of priorities and values. To object and say “that is too expensive” is to say, rather, offering equal opportunities to all genders is not as important as…something else. And in many cases, that something else may well be a corporation’s wealth or an institution’s traditions or an individual’s comfort (like my own).</p>

<p>Singer notes in the book that surveys show that white men are much more likely than others to say that the risks in our society are worth taking. It is not hard to see why: those men (like me) walk around taking risks in an environment where they might well fall, but usually won’t fall far, or won’t fall badly, and will be okay. (In extreme cases, think finance or tech, guys fail up repeatedly!) Singer does not want to take this privilege from white men: she wants white men to commit to making that privilege a universal one. <strong>We should build spaces, streets, and institutions where everyone can fail or fall and survive to try again.</strong></p>]]></content><author><name></name></author><summary type="html"><![CDATA[]]></summary><media:thumbnail xmlns:media="http://search.yahoo.com/mrss/" url="https://www.shroudedincloaksofboringness.com/images/2023_Singer_NoAccidents.jpg" /><media:content medium="image" url="https://www.shroudedincloaksofboringness.com/images/2023_Singer_NoAccidents.jpg" xmlns:media="http://search.yahoo.com/mrss/" /></entry><entry><title type="html">Don’t Blame ‘Boomers’</title><link href="https://www.shroudedincloaksofboringness.com/2023/01/05/boomtalk1.html" rel="alternate" type="text/html" title="Don’t Blame ‘Boomers’" /><published>2023-01-05T04:16:35+00:00</published><updated>2023-01-05T04:16:35+00:00</updated><id>https://www.shroudedincloaksofboringness.com/2023/01/05/boomtalk1</id><content type="html" xml:base="https://www.shroudedincloaksofboringness.com/2023/01/05/boomtalk1.html"><![CDATA[<p><img src="/images/1941_life_babies.jpg" alt="photo of four white, newborn, babies wearing white onesies in a hospital, with caption reading &quot;Figure 1. Demography as photography: the birth rate depicted in *Life*, 1941.&quot; " /></p>

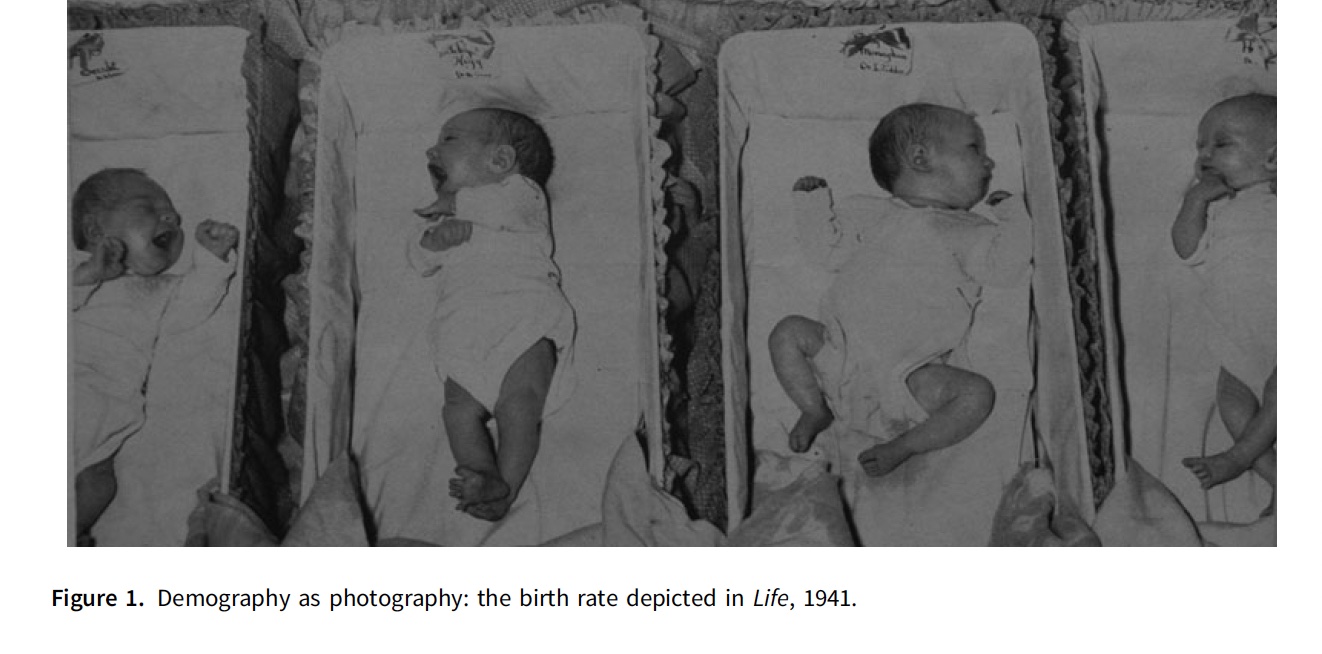
<p>In 2018, I published an <a href="https://www.cambridge.org/core/journals/modern-american-history/article/generation-crisis-how-population-research-defined-the-baby-boomers/415B6EF86FBD90D2E6D2BC9CAF345C99">article</a> that explained how and why we associate the “baby boom generation” inextricably with <strong>crisis.</strong> At first, I thought I was writing a book, but I kept running into the same problem: how to write about generations without somehow making generations either the heroes or the villains. Both options were bad, since they each lent more significance to the idea of the generation than I thought it deserved. Ultimately, I did not see how I could write an entire book about about a way of thinking (generations) that I really don’t believe in and which I have come to believe tends to do more harm than good?</p>

<p>My solution: I wrote <a href="/democracysdata/"><em>Democracy’s Data</em></a> instead, because the census was something I believed did more good than harm.</p>

<p>Still, generation talk isn’t going away and so I’m grateful to those who are fighting the good fight.</p>

<p>The other day, I stumbled upon <a href="https://doi.org/10.7146/ageculturehumanities.v6i.133335">Margaret Morganroth Gullette’s article, “<em>Boomers</em>: From Adorable Baby Bulge to #BoomerRemover.”</a> I discovered it because it cited my article, extending it in useful ways. When I presented my genealogy of the baby boomer label, I hoped to draw attention to the ways that generation talk often served to shift away blame for social ills from politics and economics. I was concerned with how generations were blamed for the supposed crisis of Social Security, for instance, when that crisis had to a large degree been manufactured in a concerted conservative effort to privatize the safety net.</p>

<p>In this essay, Gullette directs attention to the people—unhelpfully lumped together as “Boomers”—who stand to be harmed by this discourse. Gullette shows how generational talk is used to justify ageism, undercutting support for retirees (now and later) and justifying age discrimination against older workers. It was and is, again, a form of misdirection.</p>

<p>As Gullette puts it:</p>

<blockquote>
  <p>So far, the mythicized <em>Boomer</em> babies have been uniquely unfortunate in popular characterizations of their life course. As they grew older, they, not the economy, were said to decline. This brief history shows how right-wing ideology and pop culture, in a particular country, in a particular historical and economic period, worked—reframing facts, hurting older adults’ self-image, and, among the young who believe the lies, creating their too eager anticipation of having older adults retire and nursing facility residents die off. (4)</p>
</blockquote>

<p>I am not ready to call the boomers uniquely unfortunate, but I agree with the larger point. As Rebecca Onion argued in 2015, <a href="https://aeon.co/essays/generational-labels-are-lazy-useless-and-just-plain-wrong">“Against Generations,”</a> thinking in generations isn’t good for any of us. If all goes well, we all get older, and none of us want to lose our livelihoods to age discrimination. (And I still don’t want my safety net to be any further gutted or privatized either.)</p>]]></content><author><name></name></author><summary type="html"><![CDATA[]]></summary><media:thumbnail xmlns:media="http://search.yahoo.com/mrss/" url="https://www.shroudedincloaksofboringness.com/images/1941_life_babies.jpg" /><media:content medium="image" url="https://www.shroudedincloaksofboringness.com/images/1941_life_babies.jpg" xmlns:media="http://search.yahoo.com/mrss/" /></entry><entry><title type="html">Data Driven</title><link href="https://www.shroudedincloaksofboringness.com/2023/01/05/datadriven.html" rel="alternate" type="text/html" title="Data Driven" /><published>2023-01-05T04:16:35+00:00</published><updated>2023-01-05T04:16:35+00:00</updated><id>https://www.shroudedincloaksofboringness.com/2023/01/05/datadriven</id><content type="html" xml:base="https://www.shroudedincloaksofboringness.com/2023/01/05/datadriven.html"><![CDATA[<p><a href="https://press.princeton.edu/books/hardcover/9780691175300/data-driven"><img src="/images/2023_Levy_DataDriven.jpg" alt="Cover image for Karen Levy's book *Data Driven*" /></a></p>

<p>We have a problem: our society depends on trucking to get the goods we need from one place to the next. Those trucks run on major public roads alongside millions of other drivers and those trucks roll along with terrifying mass at significant speeds. (My kingdom for more trains, but that’s another post.) That situation—the existence of trucking—is not the problem though. The problem is that the industry running all those trucks has, since the late 1970s, driven down prices by driving down earnings for the skilled operators of all those giant rigs. To make ends meet, drivers put in 70 hour weeks or more, and they’re tired. We carry the resulting danger in common, all of us who ride the public roads.</p>

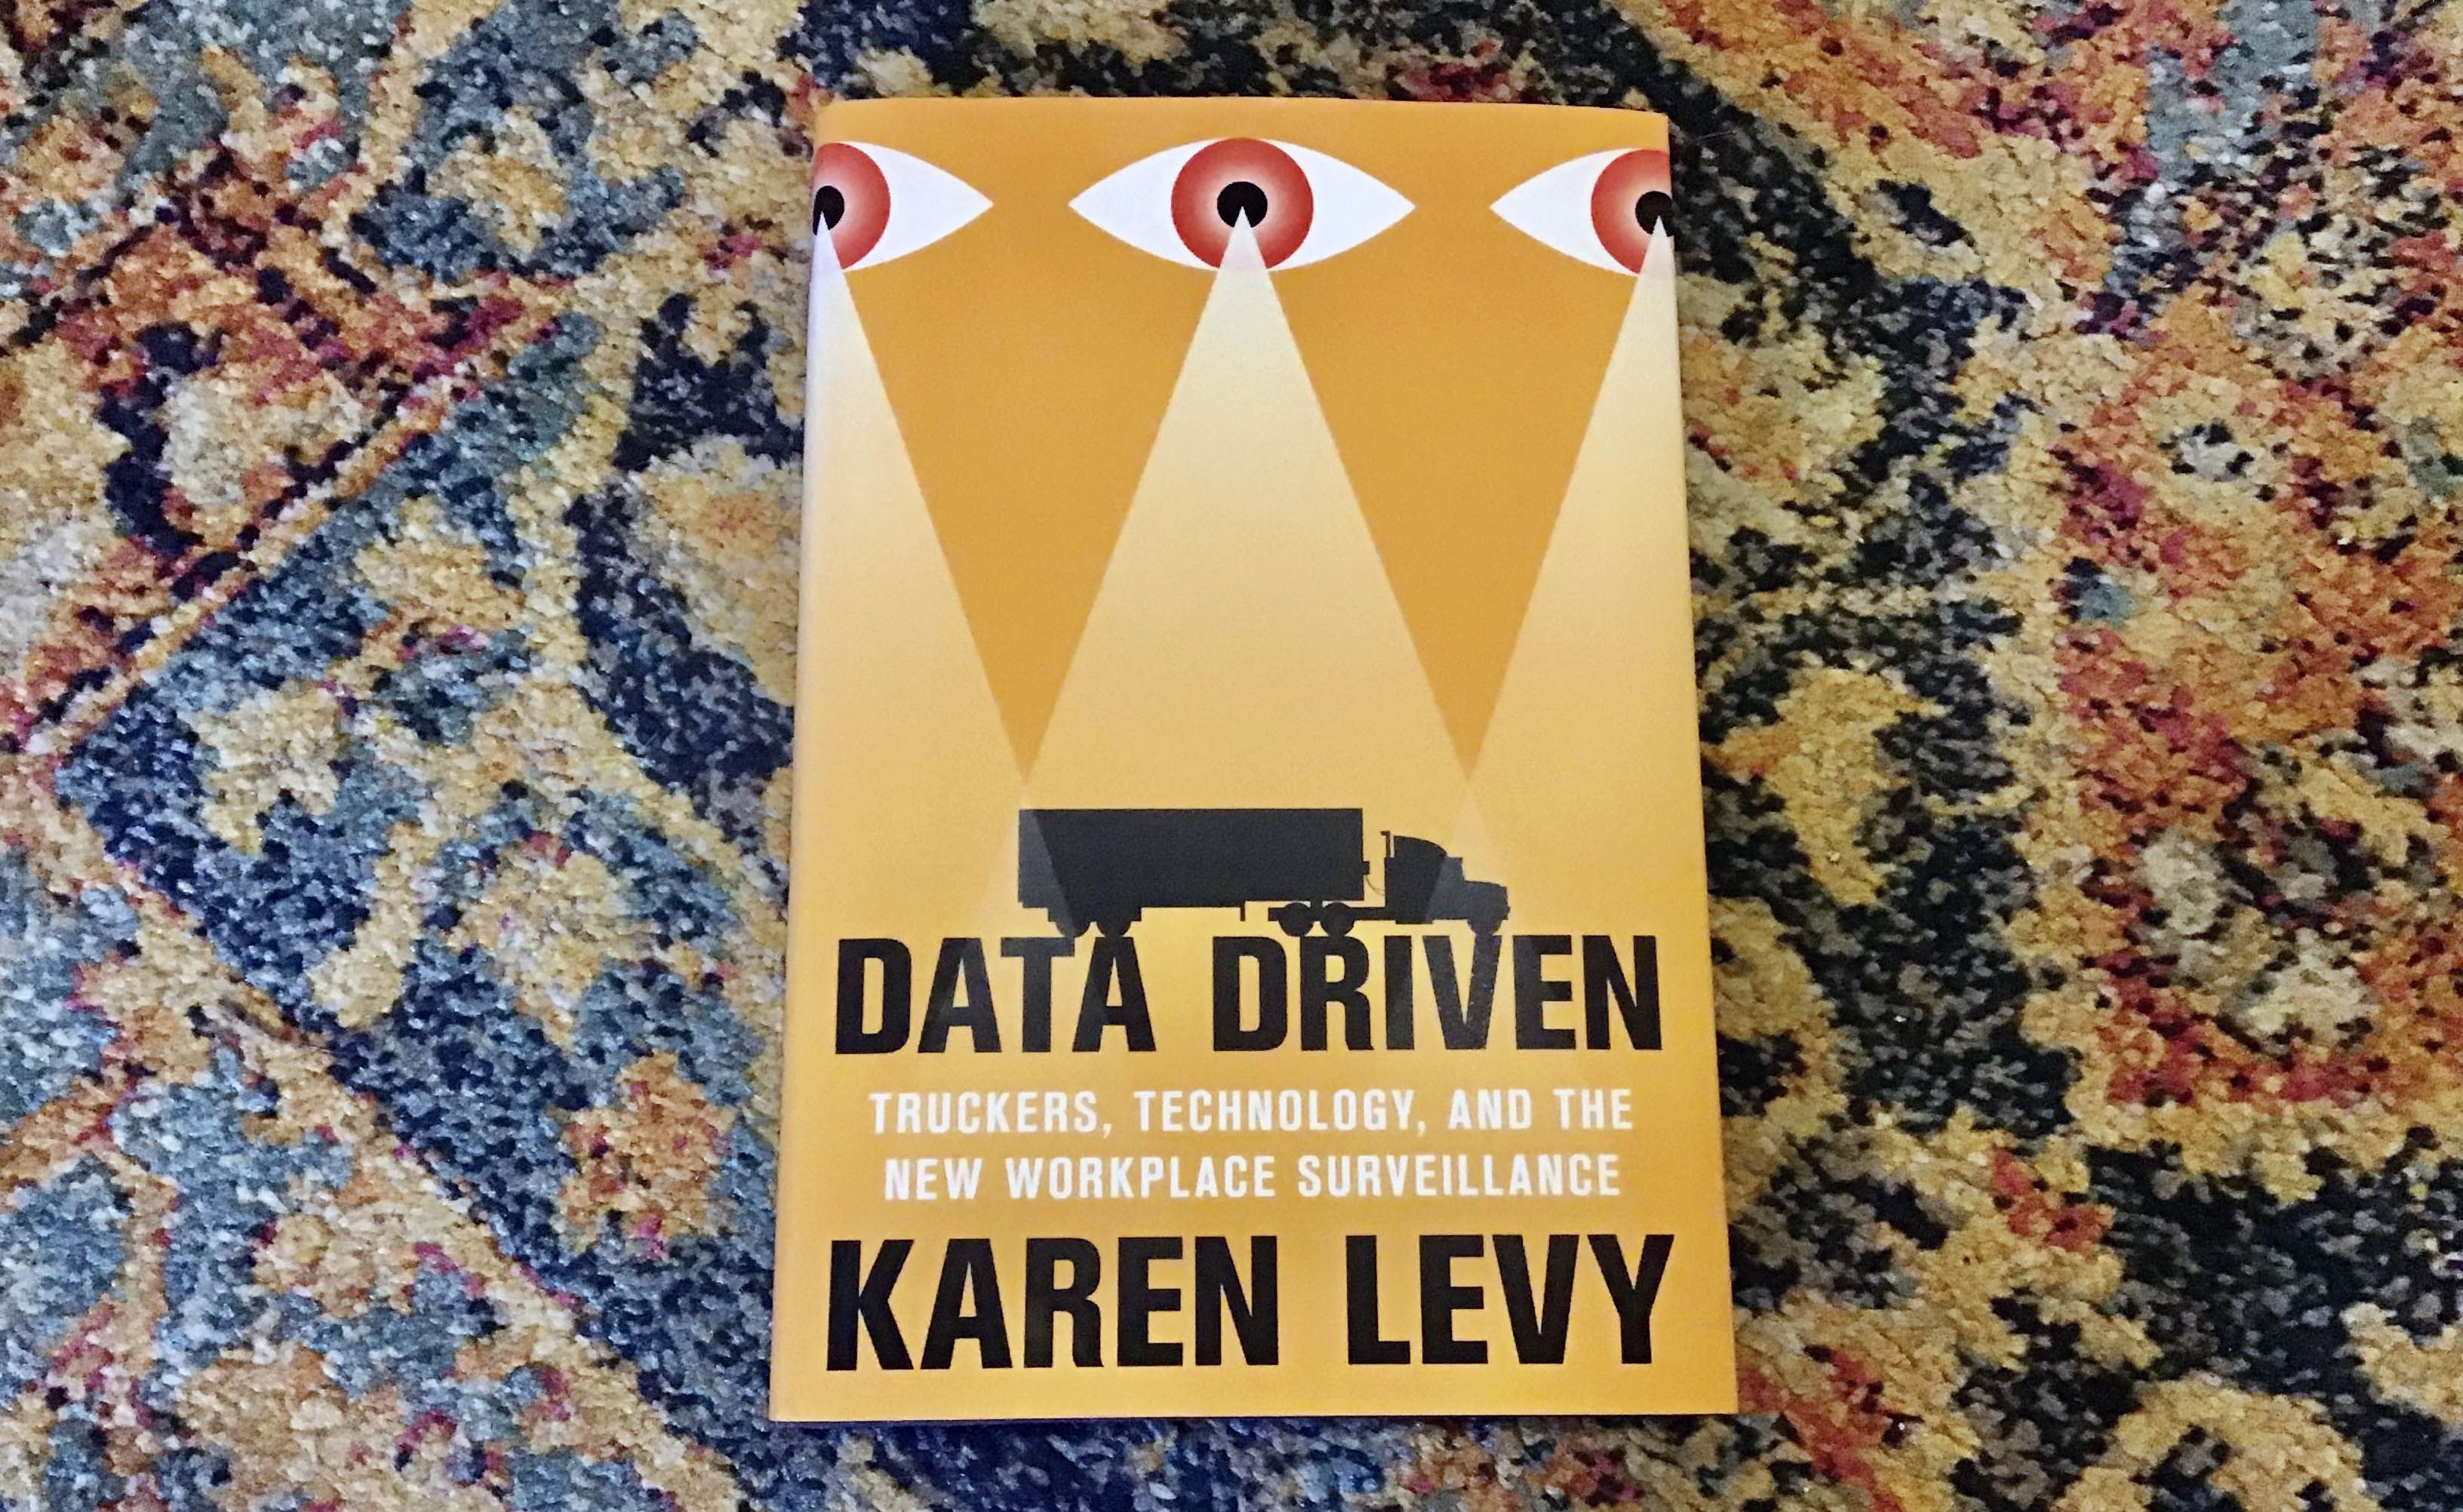
<p>Karen Levy’s <em>Data Driven: Truckers, Technology, and the New Workplace Surveillance</em> is best read in its entirety as an account of a major nation-wide attempt to solve the problem of tired truckers through technological surveillance, an argument for why tech cannot solve this problem alone, and a prophecy of more and more intense surveillance to come. And Levy’s book deserves a wide audience.</p>

<p>The heart of Levy’s story is a federally mandated transition to electronic logging devices (ELDs) from paper logs previously used to ensure compliance with laws limiting drive time and time on the clock. Those limits were meant to prevent drivers from working too much or driving too long. ELDs entered the scene as a tool to prevent fudging and fibbing. They made the rules stricter and supposedly easier to enforce. They were supposed to make the streets safer.</p>

<p>But they didn’t.</p>

<p>Levy details a host of unintended consequences, gleaned from talking to truckers and reading their trade literature, speaking with enforcement officials and reviewing official documents, and looking over the shoulders of dispatchers and trucking firm representatives. First, the ELDs did not lead to more citations for drivers out of compliance and probably not because more drivers became compliant: instead, inspectors and police found the new ELDs difficult to navigate. Savvy truckers, seeing the way that ELDs tended to get a pass at inspection stations before the mandate, even bought or fabricated fake stickers indicating they had an ELD aboard. (Levy calls this “decoy compliance.”)</p>

<p>A more troubling consequence came when truckers <em>did</em> install an ELD and lived by its rules. The strictness of the device met the pressures put on drivers to deliver their loads. Exactness pressed against desperation such that drivers took to the road at unsafe speeds or in unsafe conditions. They did what it took to get their miles under the unyielding, unforgiving digital wire. With records completed by hand, a driver could go slower, play it safer, and then lie on the log later if the hours didn’t work out perfectly. Not anymore.</p>

<p>New devices didn’t address the underlying causes of the tired driver problem. They did not ensure those drivers worked in safe conditions, with adequate pay and places to rest. Rather, they heaped on pressure while impugning the competence of professional truckers. Many of the most experienced, and safest, drivers took the hint and packed it in. When all was said and done, accidents under the new ELD mandate didn’t fall. They rose.</p>

<p>At the book’s close, Levy peers into the future. We might tell ourselves the solution to tired drivers is to speed up the exodus, replacing exhaustable humans with always-alert AIs. Alas, Levy convincingly shunts that off to the distant future, or maybe even never. Instead, she forecasts a dystopian cyborg enclosure of drivers who are already poorly paid and overworked. AIs will be involved, not as automatic drivers, but as tireless overseers: watching drivers, poking them to stay awake, and snitching when they break the rules.</p>

<p>Here, Levy’s earlier findings kick back in: tech, as ELDs, didn’t solve the problem. What would lead us to believe that more tech, more intrusive surveillance, would really make a difference?</p>

<p>Like I said: it’s worth reading all the way through.</p>

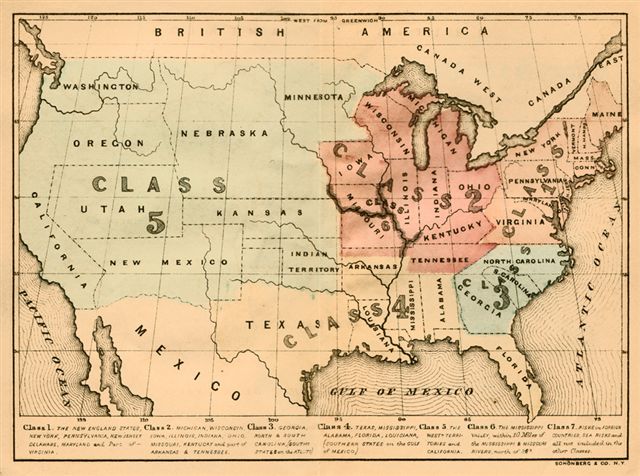
<p>And while you’re waiting for <a href="https://press.princeton.edu/books/hardcover/9780691175300/data-driven">the book</a> to arrive from your local bookseller or <a href="https://www.worldcat.org/title/1333085872">local library</a>, check out the nearly perfect hour of radio that resulted when KQED’s infectiously curious Alexis Madrigal interviewed Karen Levy. The show takes full advantage of the wonderful catalog of songs that immortalize trucking life, and then come the callers! What callers! Really, you have to give it a <a href="https://www.kqed.org/forum/2010101891750/data-driven-looks-at-surveillance-in-trucking-industry">listen.</a></p>]]></content><author><name></name></author><summary type="html"><![CDATA[]]></summary><media:thumbnail xmlns:media="http://search.yahoo.com/mrss/" url="https://www.shroudedincloaksofboringness.com/images/2023_Levy_DataDriven.jpg" /><media:content medium="image" url="https://www.shroudedincloaksofboringness.com/images/2023_Levy_DataDriven.jpg" xmlns:media="http://search.yahoo.com/mrss/" /></entry><entry><title type="html">Epidemic Disease and Insurance Statistics</title><link href="https://www.shroudedincloaksofboringness.com/2022/06/06/necropolis.html" rel="alternate" type="text/html" title="Epidemic Disease and Insurance Statistics" /><published>2022-06-06T04:16:35+00:00</published><updated>2022-06-06T04:16:35+00:00</updated><id>https://www.shroudedincloaksofboringness.com/2022/06/06/necropolis</id><content type="html" xml:base="https://www.shroudedincloaksofboringness.com/2022/06/06/necropolis.html"><![CDATA[<p><img src="/images/1860_MONY_classes.jpg" alt="a map of the United States in 1860 that divides the country into 7 geographical classes, each shaded a different color" /></p>

<p>I found myself thinking about this map of the United States recently, from the foggy valley of a covid recovery. I was coping with my own pandemic encounter by reading about yellow fever in Kathryn Olivarius’ elegant, excellent, <em>engaging</em> new book <a href="https://www.hup.harvard.edu/catalog.php?isbn=9780674241053"><em>Necropolis: Disease, Power, and Capitalism in the Cotton Kingdom.</em></a> (This book was so good that I kept reading it despite the waves of covid fatigue!)</p>

<p>The book is about New Orleans and it wrestles with a puzzle: why did a city that served as a key node of antebellum American capitalism do so little to combat the threat of yellow fever, even as other US cities launched significant and successful public health campaigns to rein in similar epidemics? Olivarius offers a deeply researched and convincing set of answers, involving a city whose “acclimated” (fever-surviving) elites made fortunes by exploiting the labor of a steady stream of migrants (enslaved and free). Even many doctors benefited from the status quo, since it allowed them to charge epidemic-prices for questionable care and eventually graduate into the planter class. Some doctors even developed elaborate theories explaining (despite abundant contradictory evidence) that slavery was perfectly suited to yellow fever, and even that it protected enslaved people who would otherwise, as free people, be doomed to extinction by some supposed trait their race. The people on top, Olivarius explains, had little incentive to tax themselves for public works that might, in the long run, undermine their own privileged positions. As a result, we as readers encounter New Orleans as a charnel house: one that churned out cotton by bleeding dry the people it attracted and then let die.</p>

<p>Yet that was <em>not</em> the picture of New Orleans that most of its acclimated residents shared with the wider world. Olivarius shows us people writing letters to family around the nation defending their adopted home against claims of unhealthfulness or insalubrity. She shows how individuals mobilized their own stories of acclimation to downplay yellow fever risk (I made it! It wasn’t that bad!), or to claim that it was a disease that hurt those who deserved it (I made it! I was worthy!).</p>

<p>I know that Olivarius is right about such letters, because I saw them while I was writing <a href="https://press.uchicago.edu/ucp/books/book/chicago/H/bo20298894.html">my first book</a>. It turns out that some of the institutions most interested in sussing out the health of New Orleans were life insurance companies, like Mutual Life of New York (MONY), which produced the map that began this post.</p>

<p>That map illustrates a scheme of classification that MONY adopted in the 1850s to encompass the United States regionally. Classes 1 and 2 contained the Northeast and the Midwest, albeit with some interesting surprises: Virginia, for instance, was treated like a northern state by MONY. Classes 1 and 2 enjoyed a privileged status. New Orleans fell in Class 4, where anyone who wanted to a policy had to pay a very hefty fee. MONY had some industry data to use to justify that penalty, but its actuary was also clearly influenced by cultural and political judgments. “In some States, the parties insured live simply and frugally and labor steadily and long,” explained the MONY actuary in 1854, before continuing with a thinly veiled condemnation of the South, its climate, and chattel slavery: “while in other States more bountifully favored in some respects, they toil less, live fast and soon accomplish their aim and—end.”</p>

<p>For Olivarius, life insurers’ penalties and judgments offer evidence of the truth about New Orleans: that it really was, for most people, a profoundly unhealthy place.</p>

<p>I think that’s right.</p>

<p>But I’ve always been just as interested in the rhetorical purpose of the data life insurers mustered, which was how I first came across defenses of New Orleans. In 1857, MONY’s southern agents and potential policyholders put pressure on the company to lower its punitive penalties for the region. MONY’s board had no intention of doing so, but it still needed an explanation—or, really, a justification. That’s where James Wynne came in.</p>

<p>MONY wanted “in order to avoid any imputation of preference or prejudice” a “Medical gentleman from a Southern State to collate and arrange the material thus collected and to make a report to the Company of the facts presented.” They chose Wynne, who was born in Utica, NY, but lived much of his adult life as a practicing physician in Baltimore. There he became an active public health reformer, wrote up <a href="https://www.google.com/books/edition/Appendix_C_to_the_Report_of_the_General/vZGJmoGlPLIC?hl=en&amp;gbpv=1">his statistical observations on cholera</a>, and even published <a href="https://archive.org/details/livesofeminentli00wynn">a series of biographical sketches</a> of Benjamin Franklin, Robert Fulton, Jonathan Edwards, Justice Marshall, David Rittenhouse, and Eli Whitney calculated to prove that “the human mind has suffered no deterioration in its transit across the Atlantic, and that…America was not deficient in contributing her quota to the development and the elevation of English literature.”</p>

<!---
James Wynne, Abstract of Report by James Wynne, M.D.. on Epidemic Cholera, As It Prevailed in the United States in 1849 and 1850 (London: George E. Eyre and William Spottiswoode, 1852)
James Wynne, Lives of Eminent Literary and Scientific Men of America (New York: D. Appleton & Co., 1850)
--->

<p>Wynne analyzed the materials MONY had received and collected, from regional doctors’ statistical treatises to public documents the company had collected—much of that material had been shared by precisely those people protesting the company’s classification map and regional penalties. Wynne did not draw on the company’s own (probably thin) evidence of policyholder mortality in New Orleans or the cotton South. In 1857, Wynne wrote and MONY published <a href="http://resource.nlm.nih.gov/60431510R"><em>Report on the Vital Statistics of the United States Made to the Mutual Life Insurance Company of New York</em></a>, which weighed in at 214 pages of text. The company published it in New York, but also London, Paris, and Madrid—it would not merely justify the company’s southern discriminations, but also generally advertise MONY and the US life insurance industry’s scientific sophistication.</p>

<p>In that report, Wynne made an important, if politically volatile, case: the divide between North and South was grounded as much in statistical laws as in their political equivalents. This was based on the collected evidence, but also a case that his life insurance patrons intended him to make. It justified MONY’s insurance map and the ways the company treated southern applicants and agents. As for New Orleans, Wynne determined that the evidence presented to him exhibited “a mortality without parallel in the United States, and show that there are causes in operation througout the State [of Louisiana] tending to render it eminently unhealthy.” (169)</p>]]></content><author><name></name></author><summary type="html"><![CDATA[]]></summary><media:thumbnail xmlns:media="http://search.yahoo.com/mrss/" url="https://www.shroudedincloaksofboringness.com/images/1860_MONY_classes.jpg" /><media:content medium="image" url="https://www.shroudedincloaksofboringness.com/images/1860_MONY_classes.jpg" xmlns:media="http://search.yahoo.com/mrss/" /></entry><entry><title type="html">Enslaved Women and the History of Quantification</title><link href="https://www.shroudedincloaksofboringness.com/2022/06/06/reckoning.html" rel="alternate" type="text/html" title="Enslaved Women and the History of Quantification" /><published>2022-06-06T04:16:35+00:00</published><updated>2022-06-06T04:16:35+00:00</updated><id>https://www.shroudedincloaksofboringness.com/2022/06/06/reckoning</id><content type="html" xml:base="https://www.shroudedincloaksofboringness.com/2022/06/06/reckoning.html"><![CDATA[<p><img src="/images/morgan_reckoning_cover.jpg" alt="Cover image of book Reckoning with Slavery by Jennifer L. Morgan" />
What did rationality look like to an enslaved woman?</p>

<p>In <a href="https://www.dukeupress.edu/reckoning-with-slavery"><em>Reckoning with Slavery</em></a>, <a href="https://as.nyu.edu/content/nyu-as/as/faculty/jennifer-morgan.html">Jennifer L. Morgan</a> works toward an answer, wrestling with sources that were often designed to deny even the possibility that an enslaved woman could have a perspective on rationality. I first read this book a couple weeks ago and it has stuck with me. I don’t entirely understand it yet—I will have to re-read and work through the evidence and arguments more slowly. But I agree with historian <a href="https://www.patriciamartinsmarcos.com/about.html">Patrícia Martins Marcos</a>, who tweeted this:</p>

<blockquote class="twitter-tweet"><p lang="en" dir="ltr">Having had to opportunity to hear Jennifer Morgan talk after reading her book this summer, I seriously believe this book should be read by historians of science, statistics, accounting, &amp; mathematics. Centering Black women as thinkers in the narratives os political economy is🔥🔥</p>&mdash; Patrícia Martins Marcos (@PatrciaMMarcos) <a href="https://twitter.com/PatrciaMMarcos/status/1528849754427375618?ref_src=twsrc%5Etfw">May 23, 2022</a></blockquote>
<script async="" src="https://platform.twitter.com/widgets.js" charset="utf-8"></script>

<p>Morgan is doing a lot and any attempt at summary or synthesis feels fraught. I’m going to attempt to draw out why this book is so important to the history of quantification, and I welcome corrections or critique.</p>

<p>Here’s what has stuck with me after reading: when a historian (like Morgan) treats enslaved women as thinking people (as intellectuals without a printing press, maybe) it becomes possible to also see what they witnessed up close: how white elites built “modernity” or “rationality,” and how frequently ugly, even horrifying, that process was. But “ugly” or “horrifying” are too vague. The historian who looks at rationality from the particular perspective of enslaved women can see more clearly than others have how it has been built to encompass and sometimes depend upon a series of lies and false premises, which together make possible the persistent injustices of racial capitalism.</p>

<p>If we follow Morgan and try to see the world through the eyes of enslaved women, we see how the building of “rationality” for Europe or America resulted from disavowing or erasing the evidence of rationality in Africa—these disavowals created a contrast that elevated capitalist modernity; these disavowals also justified the continued practice of slavery and the associated increase in wealth and power. Stories of an uncivilized Africa look foolish, Morgan explains, when we attend to the robust market economy through which enslaved women were sold to the Portuguese in the first place. European commentators could only claim that Africa lacked money and markets by discounting the money and markets that Europeans relied on to become rich. “In the sixteenth century,” Morgan writes, describing this rhetorical sleight of hand, “the Portuguese secured their dominance of the cowrie trade and, with it, the illusion that Africans lacked a rational currency.” (137-138) Cowries were a currency that Portugeuse traders used to purchase people and from which they built fortunes; and yet, contemporaries who wrote about the trade and about cowries denied this money any legitimate status. Money became, almost by definition, that which Africans did not have.</p>

<p>Following Morgan as she follows the journey of enslaved women, we see slave ships differently too, not merely as machines or spaces where terrible violence took place, but also as spaces of resistance and rebellion where women were often crucial, where some women would choose even to blow up an entire vessel, rather than subject themselves and their kin to continued violence.</p>

<p>In America, Morgan argues that the sale of enslaved women and their children should not be understood in terms of dehumanization. Even as the enslaved were commodified, they maintained their humanity: “thinking of commodification as the ultimate space of dehumanization suggests (perhaps because of the completeness of their reduction to ‘thingness’) that those being commodified were unable to perceive that the property claims made upon them were, in fact, entirely exterior to their personhood.” This path misleads, writes Morgan, because “mobilizing this concept risks obscuring that the claim that a slave was a thing was always rooted more in the status of the slave owner than the status of the slave.” (205) Morgan insists instead that enslaved women persisted in understanding their own humanity. They evidenced that understanding at times through resistance: by, for instance, aborting pregnancies or by running away to join Maroon communities. European and American writers might write about man-eating among Africans or maroons, but these women, Morgan argues, saw how those who sold them were the real cannibals.</p>

<p>Finally, false depictions of enslaved women’s family lives served as foil to the emerging ideal of the home as a sentimental space apart from the market. White commentators had somehow claimed simultaneously that African mothers routinely failed to care for their children, that they lacked some innate connection to their kin, and yet also described how traders could capture African women by using their children as bait. In the United States, the inviolability of the white family by the market became a central value just as such a distinction was explicitly denied to African slaves. White families saw that violation all around them in early years, as the sale of enslaved people involving the forced separation of loved ones, intimates, and parents and children took place in public view all over: “on piers, on board ships, after long marches through towns and into the countryside, on corners, in the back of shops, in the post office or the public house, on wharves, from the backs of wagons, inside urban living rooms, with a stranger, with a child, with a spouse, alone or in full view of those who sale would come next.” (174) Morgan argues that the contrast was part of the point: “The claims that Black women’s childbearing took place outside the realm of family life, that it was painless, that it was inconsequential, and that it did not involve emotional intensities served to sharpen the connection of birth and domesticity with privileged European women and their descendants.” (213)</p>

<p>For the history of quantification, this is an important book precisely because it argues that whiteness and calculative rationality were constructed together around the imagined failures of Africans. Working to the see through the eyes of enslaved women allows us to see that co-construction and surely challenges us to work out the implications of a rationality built in part on racist lies and violent exploitation.</p>]]></content><author><name></name></author><summary type="html"><![CDATA[What did rationality look like to an enslaved woman?]]></summary><media:thumbnail xmlns:media="http://search.yahoo.com/mrss/" url="https://www.shroudedincloaksofboringness.com/images/morgan_reckoning_cover.jpg" /><media:content medium="image" url="https://www.shroudedincloaksofboringness.com/images/morgan_reckoning_cover.jpg" xmlns:media="http://search.yahoo.com/mrss/" /></entry><entry><title type="html">Democracy as Musical Chairs</title><link href="https://www.shroudedincloaksofboringness.com/2022/05/30/housesizeviz.html" rel="alternate" type="text/html" title="Democracy as Musical Chairs" /><published>2022-05-30T04:16:35+00:00</published><updated>2022-05-30T04:16:35+00:00</updated><id>https://www.shroudedincloaksofboringness.com/2022/05/30/housesizeviz</id><content type="html" xml:base="https://www.shroudedincloaksofboringness.com/2022/05/30/housesizeviz.html"><![CDATA[<head>
<style type="text/css">
  div.cover-layout {
    width: 100%;
    max-width: 100%;
    display: flex;
    flex-wrap: nowrap;
    gap: 1rem;
  }

  div.cover-image,
  div.cover-text {
    flex-basis: 1;
    flex-grow: 0;
    width: 50%;
  }

  div.cover-image img {
    width: 100%;
    max-width: 100%;
    border: 1px solid #000;
    box-shadow: 2px 2px 16px rgba(0, 0, 0, 0.125);
  }

  @media screen and (max-width: 640px) {
    div.cover-layout {
      display: block;
    }

    div.cover-image,
    div.cover-text {
      width:  100%;
    }

    div.cover-image {
      margin-bottom: 1rem;
    }
  }
</style>

</head>
<body>

<div>

    <p>In New York City, where I live, two senior New York representatives in the US House—both Democrats, both powerful and influential, <a href="https://www.thenation.com/article/politics/new-york-redistricting-maps/">will face off</a> in an unexpected primary in August. There’s nothing wrong with some competition. Indeed, that holds particularly true for those most deeply entrenched in government. Still, it did not and does not have to be this way.</p>

    <p>Congressmembers Maloney (chair of the House Oversight Committee) and Nadler (chair of the House Judiciary) must fight for their respective survival in a newly drawn 12th district because <a href="https://www.nytimes.com/2022/05/21/nyregion/redistrict-map-nadler-maloney.html">New York courts</a> (in a <a href="https://www.nytimes.com/2022/04/27/nyregion/redistricting-congress-gerrymander-ny.html">surprise decision</a>) rejected the state’s redistricting maps. Even more fundamentally, though, they must fight because New York <a href="https://www.census.gov/library/visualizations/2021/dec/2020-apportionment-map.html">lost a seat</a> in the reapportionment of congressional representatives that followed the 2020 census.</p>

    <p>I’ll say it again:</p>

    <p><strong>It did not have to be this way.</strong></p>

    <p><strong>It does not have to be this way.</strong></p>

    <p>Let me show you what I mean: Consider this gif, which looks like the cover of <a href="/democracysdata/">my book</a>, but is in fact a data visualization.</p>

    <p>Keep your eye on the letter “a” in the upper right hand corner.</p>

    <div class="cover-layout">
  <div class="cover-image">
    <img src="/images/bouk-cover-720px.gif" alt="An image of a book cover composed of letters in alternating colors -- red, blue, and gunmetal gray." />

  </div>
  <div class="cover-text">
  <p>
    Notice how long that "a" is either blue or gray. Whenever it is blue, that means that New York state (which it represents) gained a seat in the US House after a census. That was true for NY following these censuses: 1790, 1800, 1810, 1820, 1830, 1870, 1880, 1900, 1910, and 1930. For 1890, the "a" turns gray because NY kept the same number of seats in the House of Representatives after that census. NY's "a" turns red for 1840-1860, a consequence of an abandoned attempt to limit the House's growth. In 1920, Congress failed to reapportion, and so every state's letter is gray in the visualization.
    </p>
    <p>
    From 1940 on, the "a" turns red and stays that way as New York lost seats in every successive apportionment. While that took place, the population of New York rose from 12,587,967 in 1930 to 20,215,751 in 2020. <b>Despite having nearly twice as many people to represent, the state's delegation in Congress shrunk from 45 to 26.</b>
    </p>
  </div>
</div>

    <p><br /></p>

    <p>The result has been growing Congressional districts, decreasing the likelihood that a representative will know and attend to their constituents. As Ross Barkan <a href="https://rossbarkan.substack.com/p/the-bloody-redistricting-of-yore?s=r">explains</a>, in reference to the mid-twentieth-century experience of one of New York’s most influential House members, the long-serving Emmanuel Celler: “Celler’s career reflected this reality; he went from representing two neighborhoods to parts of two boroughs.”</p>

    <p>This is not a peculiar injustice plaguing New York. It’s an entirely ordinary scandal. It happens all the time.</p>

    <p>That’s because the size of the House has been frozen for a century while the entire population has tripled. The divorce of population growth from the size of the people’s branch of government stands out in this graph, designed by Kevin Ackermann and Taylor Savell for <a href="https://USapportionment.org">USapportionment.org</a>.</p>

    <p><a href="https://USapportionment.org"><img src="/images/pop-seats-historical.jpg" alt="A graph showing the size of the US population growing exponentially, while the line showing the number of seats in the House grows steadily until 1920 and then levels off." /></a></p>

    <p>The number of people represented by each member of Congress was in the vicinity of 30,000 when the nation was founded. By the time the House reached 435 seats, that number had risen past 200,000. Now, each representative must speak for over 700,000 constituents.</p>

    <p>Now, take another look at the visualization.</p>

    <div class="cover-layout">
<div class="cover-text">
<p>
  It illustrates the results of every apportionment 1790 to 2020. To begin with, each decade passes at a stately pace in the visualization. Each of the 50 colored-in letters is coded to correspond with one state. Their placement accords, roughly, with US geography. A series of blue letters representing new states and their new representatives tracks the westward expansion of the United States. For the first half of US history, blue and gray letters abound. Congress received the results of the census in those first hundred years, deliberated and debated, and usually ended up increasing the size of the House. Then, in 1920, powerful figures in Congress decided to break tradition and hold the House steady in size. They accidentally broke the apportionment process instead. No apportionment happened, and so: all the letters turn gray.
  </p>
  <p>
  What follows, a brilliant dance of colors, is actually the frenetic shifting of seats that followed as Congress installed an <a href="https://datasociety.net/library/house-arrest/">automated apportionment system</a>. Democracy became a strange cousin to musical chairs. <b>The number of players kept growing, but the places to sit stagnated.</b>
  </p>
</div>
  <div class="cover-image">
    <img src="/images/bouk-cover-720px.gif" alt="An image of a book cover composed of letters in alternating colors -- red, blue, and gunmetal gray." />
    <i>Credit: Robin Sloan, Dan Bouk, and William Bouk, using data compiled by Taylor Savell and Nora Ma</i>
  </div>

</div>

    <p><br /></p>

    <p>There is no reason we have to play this perverse game, denying ourselves representation.</p>

    <p>At the end of 2021, the American Academy of Arts and Sciences made the case for enlarging the House in an important and compelling <a href="https://www.amacad.org/ourcommonpurpose/enlarging-the-house">bipartisan report</a>, by Lee Drutman, Jonathan D. Cohen, Yuval Levin, and Norman J. Ornstein. The authors make the case that the House’s size was once frozen on grounds of increasing its efficiency. But a House stuck at 435 seats has not proven itself efficient. In fact, they write: “Even before the budgetary and administrative growth that surely lies in the federal government’s future, at its current size, Congress can barely handle all of its duties.”(15)</p>

    <p>The report argues for an immediate addition of 149 seats, to make up in part for the long period of stasis, followed by a return to older traditions of House expansion: “Going forward, the House should continue to expand as the population grows. Specifically, Congress should endeavor to increase by the number of seats necessary to ensure that no state loses a representative, as used to be the norm (while also adding additional seats as needed to ensure that the House has an odd number of total seats.) This number is <em>not</em> the same as the number of seats that shifted between states.”(18) The authors insist that “Americans, especially those who live in states with growing populations, should not periodically <em>lose</em> representation in Washington.”(18)</p>

    <p>Democracy should not devolve into a game of musical chairs.</p>

    <hr />
    <hr />

    <p>READ MORE:</p>
    <ul>
      <li>Pre-order <a href="/democracysdata/">Democracy’s Data</a> (out August 23, 2022)</li>
      <li>watch: Danielle Allen, <a href="https://www.youtube.com/watch?v=cphaM6Mupgc">“Our Common Purpose”</a> 26 February 2021</li>
      <li>Geoffrey Skelley, <a href="https://fivethirtyeight.com/features/how-the-house-got-stuck-at-435-seats/">“How the House Got Stuck at 435 Seats,”</a> <em>FiveThirtyEight</em> 12 August 2021</li>
      <li>Editorial Board, <a href="https://www.nytimes.com/interactive/2018/11/09/opinion/expanded-house-representatives-size.html">“America Needs a Bigger House,”</a> <em>New York Times</em> 9 November 2018</li>
      <li>James Fallows, <a href="https://fallows.substack.com/p/were-stuck-with-the-senate-what-then?s=r">“We’re Stuck with the Senate. What Then?”</a> <em>Breaking the News</em> 11 December 2021</li>
    </ul>
  </div></body>]]></content><author><name></name></author><summary type="html"><![CDATA[]]></summary></entry><entry><title type="html">‘And So You Do’ (aka census records of the rich and famous)</title><link href="https://www.shroudedincloaksofboringness.com/2022/04/23/finds.html" rel="alternate" type="text/html" title="‘And So You Do’ (aka census records of the rich and famous)" /><published>2022-04-23T04:16:35+00:00</published><updated>2022-04-23T04:16:35+00:00</updated><id>https://www.shroudedincloaksofboringness.com/2022/04/23/finds</id><content type="html" xml:base="https://www.shroudedincloaksofboringness.com/2022/04/23/finds.html"><![CDATA[<p>Our History Lab has been on a hunt for notable people in the 1950 census. In <a href="/2022/04/20/1950census.html">another post</a>, I wrote a bit about the “thrill of the chase.” I asked Ashley Tourtelot, a lab member and Colgate senior, to reflect further on what drives her to go looking for one person, and then another, and then another. She put it this way:</p>
<blockquote>
  <p>The task begins once you have a name in mind, and from then on, you partake in a mini scavenger hunt. First, you search for the person adding state and county, but you are left with nothing after screening ten, maybe twenty, pages of results. You are forced to narrow your search, do some extra digging, and learn more about the person you knew very little about. <strong>Suddenly, finding a person becomes more meaningful because you are not looking for simply a name anymore; you are looking to find a person who is at first lost in the record.</strong> Then you finally narrow your search down, to be met with another series of pages to look over. As you go through each page, you feel yourself getting closer and closer to finding that name because you are in the home stretch, and without expecting it, but knowing you have the pieces there, suspense and expectancy shift into rapid reward. It is like putting the last piece of the puzzle in. <strong>The immediate satisfaction of recovering that name, knowing that the person is there, makes you want to do more, and so you do.</strong></p>
</blockquote>

<p>I think Ashley puts her finger on what makes the census search so satisfying. It is like Wordle or Sudoku, a (usually) solvable puzzle that is just difficult enough. But, unlike those games, it also feels meaningful. It feels like an act of recovery, or rescue from obscurity. It feels like finding a person.</p>

<p>Who does our lab go looking for? Ashley had a bit to say about that too. She reminds us that while the 1950s are “far enough in the past to hit that seventy-two-year marker and become public,” they are “not that long ago.”
She continues: “When I think of the 50s, I think of my grandparents. So there is that somewhat distant connection to a time you did not physically inhabit but have some relationship with indirectly, and that reality drives your search.”</p>

<p>This post will be updated occasionally and will serve to collect many (though not all) of our 1950 census finds. It comprises mostly the famous or otherwise notable, the people who lab members thought of when they thought of their grandparents’ generation.</p>

<p>In alphabetical order, using the name with which the person is presently known:</p>

<h2>Ruth Bader-Ginsburg</h2>
<p>Found by Ashley Tourtelot<br />
<a href="https://1950census.archives.gov/search/?state=NY&amp;county=Kings&amp;ed=24-258#.YmP58stkEPw.link">Kings County, NY, E.D. 24-258, Sheet 73</a>
<img src="/images/1950_RBG_ex1.jpg" alt="recording showing Ruth Bader as a 17-year-old" />
The sheet notes that Nathan Bader was a naturalized citizen and that he owned his own business.</p>

<h2>W.E.B. Du Bois</h2>
<p>Found by Dan Bouk, following Leah Massa’s lead <br />
<a href="https://1950census.archives.gov/search/?state=NY&amp;county=New%20York&amp;ed=31-1756#.YmPz3m-MDWA.link">Manhattan, New York County, New York, E.D. 31-1756, Sheet 1</a>
<img src="/images/1950_WEB_DuBois_ex1.jpg" alt="recording showing Du Bois as an 82-year-old" /> The 82-year-old Du Bois lived in not only the same E.D., but the same apartment building as Thurgood Marshall (below). Both lived at 409 Edgecomb Avenue.</p>

<h2>Thurgood Marshall</h2>
<p>Found by Leah Massa <br />
<a href="https://1950census.archives.gov/search/?state=NY&amp;county=New%20York&amp;ed=31-1756#.YmPz3l7aTXA.link">Manhattan, New York County, New York, E.D. 31-1756, Sheet 3</a>
<img src="/images/1950_Thurgood_Marshall_ex1.jpg" alt="recording showing Thurgood and Vivien Marshall" />
Marshall is listed as a “lawyer” for the “NAACP.” This is four years before Marshall won the <em>Brown v. Board of Education</em> case. Marshall’s name happened to fall on a sample survey line and so was asked further questions, including about this income: in 1949, he earned $7,500.</p>
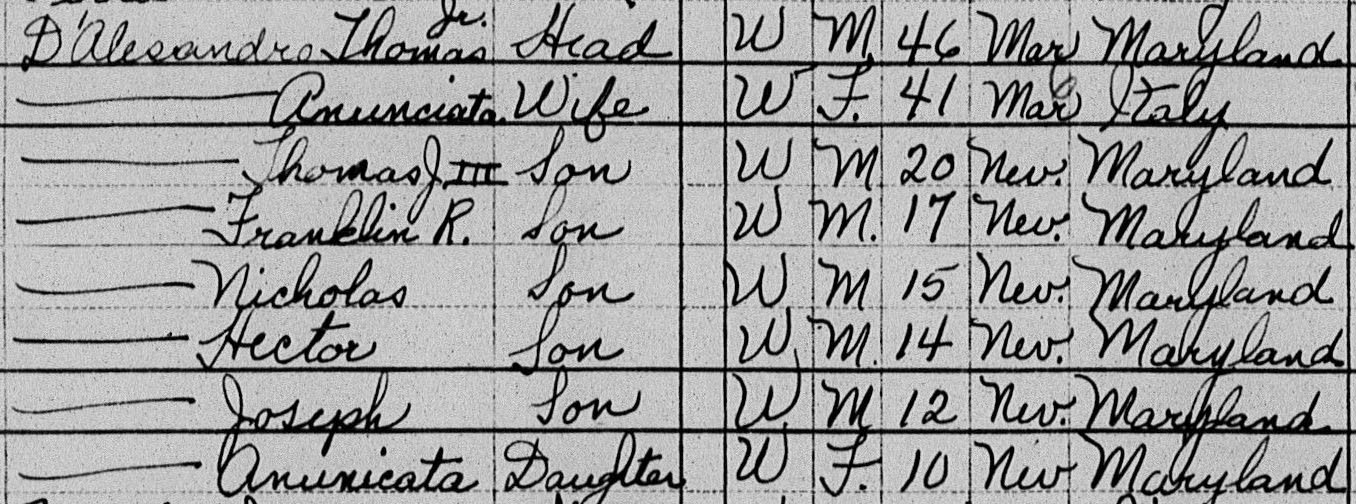
<h2>Nancy Pelosi</h2>
<p>Found by Leah Massa <br />
<a href="https://1950census.archives.gov/search/?state=MD&amp;county=Baltimore&amp;ed=4-96#.YmPz3lHPBBw.link">Baltimore, Maryland, E.D. 4-96, Sheet 74</a>
<img src="/images/1950_Nancy_Pelosi_ex1.jpg" alt="Nancy Pelosi recorded as Anunciata D'Alesandro" />
Nancy is here recorded as Anunciata. Her father Thomas is listed as Mayor of Baltimore and her mother (also Anunciata, a naturalized citizen born in Italy) as “proprietor” of a “Demonstration Office” (after “Beauty Shop” has been crossed out).</p>
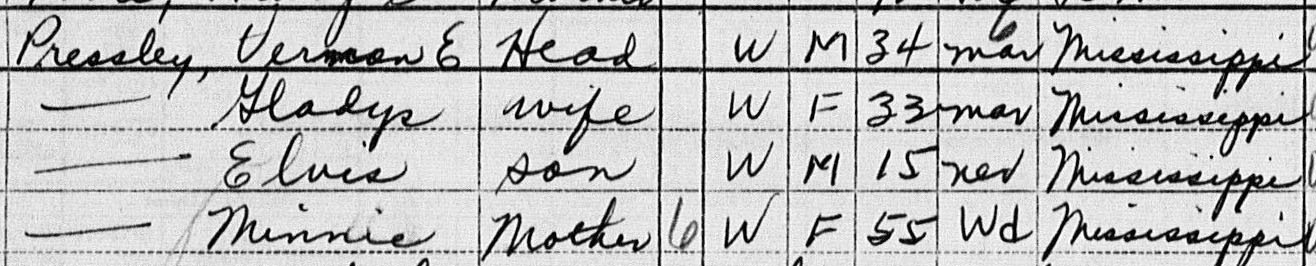
<h2>Elvis Presley</h2>
<p>Found by Leah Massa <br />
<a href="https://1950census.archives.gov/search/?state=TN&amp;county=Memphis,%20Shelby&amp;ed=98-4#.YmPz3qv5_jU.link">Memphis, Shelby County, Tennessee, E.D. 98-4, Sheet 22</a>
<img src="/images/1950_Elvis_Presley_ex1.jpg" alt="recording showing Elvis Presley as a 15-year-old" /></p>

<h2>Frank Sinatra</h2>
<p>Found by Leah Massa <br />
<a href="https://1950census.archives.gov/search/?state=CA&amp;county=Los%20Angeles&amp;ed=66-783#.YmPz3m8FJ7s.link">Los Angeles, LA County, California, E.D. 66-783, Sheet 24</a>
<img src="/images/1950_Sinatra_ex1.jpg" alt="recording showing Frank Sinatra and family" />
This record shows Sinatra’s entire household, which included a cook, butler, maid, and nurse. The name of the cook, Maimie Kingsbury (or something like that), fell on a sample line and so we know that this 49-year-old African American woman from Texas was paid $1,920 in 1949. Frank Sinatra’s name also fell on the sample line and he is reported as earning 9U, which appears to have been the code the top income bracket.</p>]]></content><author><name></name></author><summary type="html"><![CDATA[Our History Lab has been on a hunt for notable people in the 1950 census. In another post, I wrote a bit about the “thrill of the chase.” I asked Ashley Tourtelot, a lab member and Colgate senior, to reflect further on what drives her to go looking for one person, and then another, and then another. She put it this way: The task begins once you have a name in mind, and from then on, you partake in a mini scavenger hunt. First, you search for the person adding state and county, but you are left with nothing after screening ten, maybe twenty, pages of results. You are forced to narrow your search, do some extra digging, and learn more about the person you knew very little about. Suddenly, finding a person becomes more meaningful because you are not looking for simply a name anymore; you are looking to find a person who is at first lost in the record. Then you finally narrow your search down, to be met with another series of pages to look over. As you go through each page, you feel yourself getting closer and closer to finding that name because you are in the home stretch, and without expecting it, but knowing you have the pieces there, suspense and expectancy shift into rapid reward. It is like putting the last piece of the puzzle in. The immediate satisfaction of recovering that name, knowing that the person is there, makes you want to do more, and so you do.]]></summary></entry></feed>